Demografia de Rotglā i Corberā
Esta informaciķn pretende ofrecer una visiķn actual de la informaciķn demográfica puesta a disposiciķn por el INE a través de sus diferentes publicaciones estadísticas, sobre todo usando como fuente el Padrķn Municipal que se actualiza anualmente.
Mapa edad edificaciones
Evoluciķn poblaciķn 1900 hasta 2024
Habitantes segun lugar de nacimiento
Pirámide de poblaciķn
Crecimiento Natural o Vegetativo
Numero de Matrimonios
Residentes en el Extranjero
Estadística del IRPF
Transacciones Inmobiliarias 3ē Trimestre de 2024
Afiliados a la Seguridad Social a Febrero de 2025
Paro registrado a Febrero de 2025
Estadisticas Turismo a Diciembre de 2024
Matriculaciones vehículos en Mayo de 2024
Habitantes en municipios cercanos
Habitantes provincia de Valencia 2024
(Ir al Índice)Evoluciķn poblaciķn 1900 hasta 2024
Habitantes segun lugar de nacimiento
Pirámide de poblaciķn
Crecimiento Natural o Vegetativo
Numero de Matrimonios
Residentes en el Extranjero
Estadística del IRPF
Transacciones Inmobiliarias 3ē Trimestre de 2024
Afiliados a la Seguridad Social a Febrero de 2025
Paro registrado a Febrero de 2025
Estadisticas Turismo a Diciembre de 2024
Matriculaciones vehículos en Mayo de 2024
Habitantes en municipios cercanos
Habitantes provincia de Valencia 2024
Mapa edad edificaciones.
En el siguiente mapa se puede observar la edad de los edificios de Rotglā i Corberā, los datos provienen del Catastro y están actualizados a Octubre de 2019 .
Cada color representa una década, excepto el Negro que representa todos los edificios anteriores a 1900,que suele ser el casco histķrico, en el mapa puede apreciarse como ha sido el desarrollo urbanístico de Rotglā i Corberā a lo largo del tiempo.
En la tabla posterior podemos ver la cantidad de superficie construida (en m2) por década,así como la posiciķn que ocupa el municipio en un Top nacional y provincial para cada década.
En la tabla posterior podemos ver la cantidad de superficie construida (en m2) por década,así como la posiciķn que ocupa el municipio en un Top nacional y provincial para cada década.
| Superficie Construida | ||||
| Decada | % Total | Top Provincial | Top Nacional* | |
| <1900 | 0.18% | <- 228ē -> | <- 4786ē -> | |
| 1900-1909 | 5.11% | <- 141ē -> | <- 4018ē -> | |
| 1910-1919 | 0.00% | <- 266ē | <- 7238ē -> | |
| 1920-1929 | 0.31% | <- 225ē -> | <- 5860ē -> | |
| 1930-1939 | 28.94% | <- 30ē -> | <- 315ē -> | |
| 1940-1949 | 0.70% | <- 230ē -> | <- 5823ē -> | |
| 1950-1959 | 4.99% | <- 161ē -> | <- 2992ē -> | |
| 1960-1969 | 5.25% | <- 188ē -> | <- 3314ē -> | |
| 1970-1979 | 13.17% | <- 180ē -> | <- 2705ē -> | |
| 1980-1989 | 12.05% | <- 183ē -> | <- 3159ē -> | |
| 1990-1999 | 8.01% | <- 182ē -> | <- 3350ē -> | |
| 2000-2009 | 20.22% | <- 175ē -> | <- 2609ē -> | |
| 2010-2019 | 1.09% | <- 212ē -> | <- 4348ē -> | |
| Mapa edificaciones en otros Municipios |
(Ir al Índice)
Evoluciķn de la poblaciķn desde 1900 hasta 2024.
Segun los datos publicados por el INE a 1 de Enero de 2024 el número de habitantes en Rotglā i Corberā es de 1.158, 7 habitantes menos que el en el aņo 2023. En el grafico siguiente se puede ver cuantos habitantes tiene Rotglā i Corberā a lo largo de los aņos.| Habitantes en otros municipios | ||
| Municipio | Habitantes | Diferencia (2023) |
| Valencia | 825.948 | +18.255 |
| Xātiva | 30.378 | +306 |
| Canals | 13.415 | +253 |
| la Granja de la Costera | 294 | +6 |
| Llanera de Ranes | 1.057 | +3 |
Actualmente la densidad de poblacion en Rotglā i Corberā es de 185,08 habitantes por Km2.
Tabla con la evoluciķn del número de hombres ,mujeres y total a lo largo de los aņos.
| Evoluciķn de la poblaciķn desde 1900 hasta 2024 | |||
| Aņo | Hombres | Mujeres | Total |
| 2024 | 577 | 581 | 1.158 |
| 2023 | 580 | 585 | 1.165 |
| 2022 | 576 | 587 | 1.163 |
| 2021 | 568 | 578 | 1.146 |
| 2020 | 555 | 562 | 1.117 |
| 2019 | 572 | 566 | 1.138 |
| 2018 | 560 | 554 | 1.114 |
| 2017 | 557 | 551 | 1.108 |
| 2016 | 558 | 565 | 1.123 |
| 2015 | 567 | 577 | 1.144 |
| 2014 | 564 | 573 | 1.137 |
| 2013 | 565 | 570 | 1.135 |
| 2012 | 591 | 603 | 1.194 |
| 2011 | 601 | 607 | 1.208 |
| 2010 | 591 | 599 | 1.190 |
| 2009 | 615 | 620 | 1.235 |
| 2008 | 614 | 609 | 1.223 |
| 2007 | 557 | 563 | 1.120 |
| 2006 | 531 | 528 | 1.059 |
| 2005 | 512 | 506 | 1.018 |
| 2004 | 493 | 506 | 999 |
| 2003 | 484 | 509 | 993 |
| 2002 | 492 | 496 | 988 |
| 2001 | 513 | 512 | 1.025 |
| 2000 | 512 | 523 | 1.035 |
| 1999 | 503 | 511 | 1.014 |
| 1998 | 512 | 504 | 1.016 |
| 1996 | 515 | 504 | 1.019 |
| 1995 | 520 | 509 | 1.029 |
| 1994 | 525 | 511 | 1.036 |
| 1993 | 517 | 511 | 1.028 |
| 1992 | 507 | 500 | 1.007 |
| 1991 | 507 | 504 | 1.011 |
| 1990 | 520 | 534 | 1.054 |
| 1989 | 515 | 525 | 1.040 |
| 1988 | 525 | 529 | 1.054 |
| 1987 | 533 | 531 | 1.064 |
| 1986 | 533 | 534 | 1.067 |
| 1981 | 0 | 0 | 1.068 |
| 1970 | 0 | 0 | 1.062 |
| 1960 | 0 | 0 | 1.004 |
| 1950 | 0 | 0 | 1.017 |
| 1940 | 0 | 0 | 1.096 |
| 1930 | 0 | 0 | 1.006 |
| 1920 | 0 | 0 | 970 |
| 1910 | 0 | 0 | 990 |
| 1900 | 0 | 0 | 973 |
(Ir al Índice)
Poblacion Máxima Estacional.
La poblaciķn estacional máxima es una estimaciķn de la poblaciķn máxima que soporta Rotglā i Corberā. En el cálculo se incluyen las personas que tienen algún tipo de vinculaciķn o relaciķn con el municipio, ya sea porque residen, trabajan, estudian o pasan algún período de tiempo en él. Los datos son publicados anualmente por el Ministerio de Hacienda y Administraciones Públicas, en colaboraciķn con las Diputaciones Provinciales, Cabildos y Consejos Insulares.| Poblacion Estacional Máxima | |||
| Aņo | Personas | ||
| 2016 | 1.699 | ||
| 2015 | 1.676 | ||
| 2014 | 1.676 | ||
| 2013 | 1.670 | ||
| 2012 | 1.627 | ||
| 2011 | 1.618 | ||
| 2010 | 1.496 | ||
| 2009 | 1.392 | ||
| 2008 | 1.099 | ||
| 2005 | 1.074 | ||
| 2000 | 1.100 | ||
(Ir al Índice)
Habitantes segun lugar de nacimiento.
Según los datos publicados por el INE procedentes del padrķn municipal de 2022 el 35.77% (416) de los habitantes empadronados en el Municipio de Rotglā i Corberā han nacido en dicho municipio, el 56.23% han emigrado a Rotglā i Corberā desde diferentes lugares de Espaņa, el 49.61% (577) desde otros municipios de la provincia de Valencia, el 1.03% (12) desde otras provincias de la Comunidad Valenciana, el 5.59% (65) desde otras comunidades autķnomas y el 8.00% (93) han emigrado a Rotglā i Corberā desde otros países.
 |  |  |
| Estructura en otros Municipios |
En el siguiente gráfico podemos ver la evoluciķn de la estructura de la poblaciķn en el municipio de Rotglā i Corberā si lo comparamos con 2021 vemos
- Disminuyen (-1) los habitantes nacidos en Rotglā i Corberā, pasando del 36.39% al 35.77%.
- Aumentan (12) los habitantes nacidos en la provincia de Valencia, pasando del 49.30% al 49.61%.
- Aumentan (1) los habitantes nacidos en la Comunidad Valenciana, pasando del 0.96% al 1.03%.
- Aumentan (3) los habitantes nacidos en el resto de Espaņa, pasando del 5.41% al 5.59%.
- Aumentan (2) los habitantes nacidos en otros países, pasando del 7.94% al 8.00%.
- Disminuyen (-55) los habitantes nacidos en Rotglā i Corberā, pasando del 46.22% al 35.77%.
- Aumentan (109) los habitantes nacidos en la provincia de Valencia, pasando del 45.93% al 49.61%.
- Aumentan (5) los habitantes nacidos en la la Comunidad Valenciana, pasando del 0.69% al 1.03%.
- Disminuyen (-2) los habitantes nacidos en el resto de Espaņa, pasando del 6.58% al 5.59%.
- Aumentan (87) los habitantes nacidos en otros países, pasando del 0.59% al 8.00%.
 |  |  |
Segun los datos ofrecidos por el INE en la estadistica del Padrķn los habitantes empadronados en Rotglā i Corberā que han nacido en otros países ascienden a 93.
- 16 habitantes, 8 hombres y 8 mujeres nacidos en América.
- 14 habitantes, 8 hombres y 6 mujeres nacidos en África.

 |  |  |
| Habitantes segun Pais de Nacimiento | |||
| Pais | 2022 | Dif (2021) | |
| Bulgaria | 14 | -3 | |
| Francia | 9 | 1 | |
| Polonia | 14 | -5 | |
| Reino Unido | 10 | 2 | |
| Alemania | 2 | 0 | |
| Rumanía | 10 | 1 | |
| Marruecos | 13 | 0 | |
| Argentina | 4 | 2 | |
| Brasil | 1 | 0 | |
| Ecuador | 1 | 0 | |
| Paraguay | 2 | 0 | |
| Perú | 1 | 0 | |
| Uruguay | 2 | 2 | |
| Otros | 10 | 2 | |

 |  |  |
Teniendo en cuenta la proporciķn de habitantes nacidos en otro pais sobre la poblaciķn total del municipio, hemos realizado un ranking, en el que la 1Ē posiciķn esta ocupada por el municipio con una proporciķn mayor de habitantes nacidos en otro pais, aquí puede verse en que lugar esta el municipio de Rotglā i Corberā y sus municipios cercanos.
| Top Municipal % Habitantes nacidos en otro pais | |||
| Provincia | Municipio | Pos | % |
| Alicante | Gaianes | 1.827 | 13,32 |
| Valencia | Llanera de Ranes | 3.035 | 9,57 |
| Soria | Reznos | 3.650 | 8,00 |
| Valencia | Rotglā i Corberā | 3.651 | 8,00 |
| Barcelona | Fogars de la Selva | 3.652 | 7,99 |
| Valencia | Cerdā | 4.207 | 6,84 |
| Valencia | Novelé/Novetlč | 4.333 | 6,62 |
| Valencia | Vallés | 5.473 | 4,64 |
| Valencia | la Granja de la Costera | 6.121 | 3,62 |
| Valencia | Torrella | 6.530 | 2,99 |
 |  |  |
| Pirámide en otros Municipios |
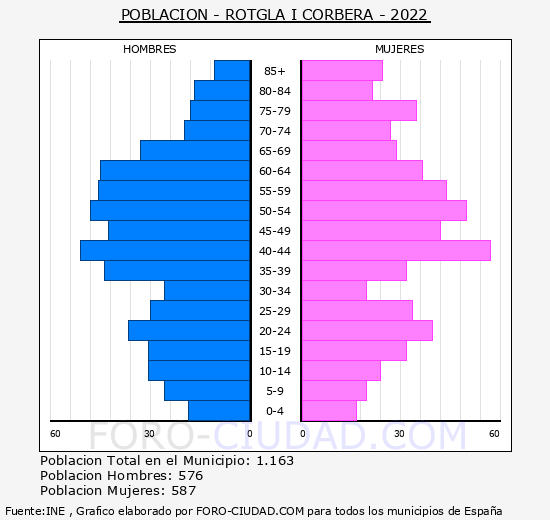
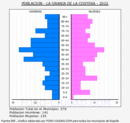
La media de edad de los habitantes de Rotglā i Corberā es de 44,41 aņos, 0,36 aņos mas que hace un lustro que era de 44,05 aņos.
| Poblaciķn de Rotglā i Corberā por sexo y edad 2022 (grupos quinquenales) | |||
| Edad | Hombres | Mujeres | Total |
| 0-5 | 19 | 17 | 36 |
| 5-10 | 26 | 20 | 46 |
| 10-15 | 31 | 24 | 55 |
| 15-20 | 31 | 32 | 63 |
| 20-25 | 37 | 40 | 77 |
| 25-30 | 30 | 34 | 64 |
| 30-35 | 26 | 20 | 46 |
| 35-40 | 44 | 32 | 76 |
| 40-45 | 51 | 57 | 108 |
| 45-50 | 43 | 42 | 85 |
| 50-55 | 48 | 50 | 98 |
| 55-60 | 46 | 44 | 90 |
| 60-65 | 45 | 37 | 82 |
| 65-70 | 33 | 29 | 62 |
| 70-75 | 20 | 27 | 47 |
| 75-80 | 18 | 35 | 53 |
| 80-85 | 17 | 22 | 39 |
| 85- | 11 | 25 | 36 |
| Total | 576 | 587 | 1.163 |
La poblacion menor de 18 aņos en Rotglā i Corberā es de 172 (95 H, 77 M ), el 14,8%.
La poblacion entre 18 y 65 aņos en Rotglā i Corberā es de 766 (390 H, 376 M ), el 65,9%.
La poblacion mayor de 65 aņos en Rotglā i Corberā es de 225 (91 H, 134 M ), el 19,3%.
 |  |  |
(Ir al Índice)
Crecimiento Natural o Vegetativo.
El crecimiento natural de la poblaciķn en el municipio de Rotglā i Corberā, según los últimos datos publicados por el INE para el aņo 2022 ha sido Negativo, con 1 defunciones mas que nacimientos.  |  |  |
Tabla con la evoluciķn del número de nacimientos , defunciones y crecimiento vegetativo.
| Evoluciķn Nacimientos y Defunciones desde 1996 hasta 2022 | |||
| Aņo | Nacimientos | Fallecidos | Diferencia |
| 2022 | 4 | 5 | -1 |
| 2021 | 6 | 13 | -7 |
| 2020 | 4 | 10 | -6 |
| 2019 | 9 | 15 | -6 |
| 2018 | 5 | 17 | -12 |
| 2017 | 8 | 14 | -6 |
| 2016 | 7 | 17 | -10 |
| 2015 | 8 | 18 | -10 |
| 2014 | 9 | 12 | -3 |
| 2013 | 8 | 11 | -3 |
| 2012 | 11 | 12 | -1 |
| 2011 | 6 | 11 | -5 |
| 2010 | 8 | 13 | -5 |
| 2009 | 6 | 16 | -10 |
| 2008 | 9 | 11 | -2 |
| 2007 | 15 | 7 | 8 |
| 2006 | 10 | 7 | 3 |
| 2005 | 9 | 12 | -3 |
| 2004 | 6 | 17 | -11 |
| 2003 | 14 | 12 | 2 |
| 2002 | 7 | 8 | -1 |
| 2001 | 12 | 15 | -3 |
| 2000 | 8 | 9 | -1 |
| 1999 | 13 | 13 | 0 |
| 1998 | 8 | 12 | -4 |
| 1997 | 14 | 10 | 4 |
| 1996 | 8 | 13 | -5 |
(Ir al Índice)
Evoluciķn número de Matrimonios.
En el siguiente grafico y tabla podemos ver la evoluciķn en el número de matrimonios que se han otorgado en el Municipio de Rotglā i Corberā hasta el aņo 2022.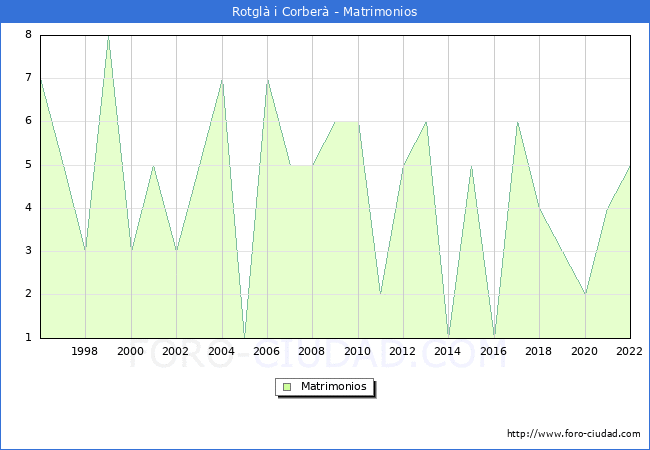
 |  |  |
| Evoluciķn Matrimonios desde 1996 hasta 2022 | |
| Aņo | Matrimonios |
| 2022 | 5 |
| 2021 | 4 |
| 2020 | 2 |
| 2019 | 3 |
| 2018 | 4 |
| 2017 | 6 |
| 2016 | 1 |
| 2015 | 5 |
| 2014 | 1 |
| 2013 | 6 |
| 2012 | 5 |
| 2011 | 2 |
| 2010 | 6 |
| 2009 | 6 |
| 2008 | 5 |
| 2007 | 5 |
| 2006 | 7 |
| 2005 | 1 |
| 2004 | 7 |
| 2003 | 5 |
| 2002 | 3 |
| 2001 | 5 |
| 2000 | 3 |
| 1999 | 8 |
| 1998 | 3 |
| 1997 | 5 |
| 1996 | 7 |
(Ir al Índice)
Residentes en el extranjero.
Segun los datos publicados por el INE en el CERA, Censo Electoral de espaņoles residentes en el extranjero a 1 de Noviembre de 2024 los los espaņoles que residen habitualmente en el extranjero o han trasladado al extranjero su residencia habitual mayores de 18 aņos eran 26 personas con municipio de origen en Rotglā i Corberā.
 |  |  |
(Ir al Índice)
En 2019 Rotglā i Corberā se sitúa como el municipio nē175 con una mayor renta bruta media de la provincia de Valencia, y en la posiciķn nē305 en la Comunidad Valenciana, el 3013 a nivel Nacional (sin PV y Navarra), abajo se muestra una tabla con las posiciķnes en las que se encuentran los municipios cercanos y con poblaciķn parecida.
Los habitantes de Rotglā i Corberā liquidaron 1.197.558€ en concepto de IRPF en el aņo 2019 y recibieron por parte de las diferentes administraciones de forma directa en el presupuesto municipal (capitulo 4 Y 7) 832.821€ un 69,54% de lo aportado, en la siguiente tabla podemos ver las cifras de los municipios cercanos o de poblaciķn similar.
Estadística del IRPF
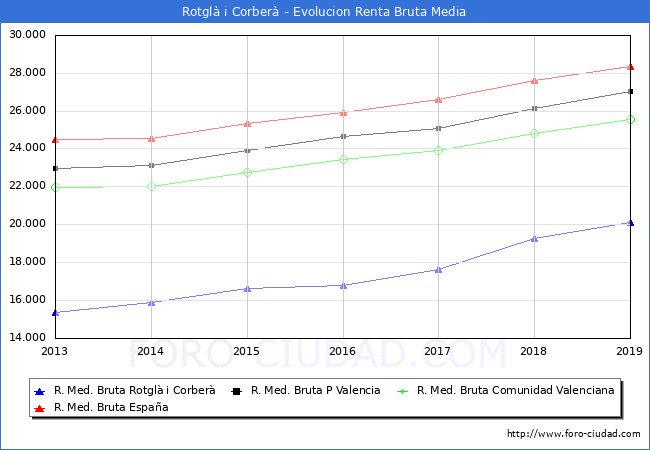
Segun los datos hechos publicos por el Ministerio de Hacienda la renta bruta media por declarante, en el municipio de Rotglā i Corberā en 2019 fue de 20.115€, 834€ mas que en el aņo 2018 . Una vez descontada la liquidacion por IRPF y lo aportado a la Seguridad Social la renta disponible media por declarante se situķ en 17.132€, 630€ mas que en el aņo 2018.  |  |  |
| Evoluciķn de la Renta Media en Rotglā i Corberā | ||||
| Aņo | Renta Bruta | Var | Renta Dispo | Var |
| 2019 | 20.115€ | 834€ (4,15%) | 17.132€ | 630€ (3,68%) |
| 2018 | 19.281€ | 1.675€ (8,69%) | 16.502€ | 1.299€ (7,87%) |
| 2017 | 17.606€ | 845€ (4,80%) | 15.203€ | 599€ (3,94%) |
| 2016 | 16.761€ | 166€ (0,99%) | 14.604€ | 145€ (0,99%) |
| 2015 | 16.595€ | 701€ (4,22%) | 14.459€ | 709€ (4,90%) |
| 2014 | 15.894€ | 540€ (3,40%) | 13.750€ | 365€ (2,65%) |
| 2013 | 15.354€ | 0€ (0,00%) | 13.385€ | 0€ (0,00%) |
En 2019 Rotglā i Corberā se sitúa como el municipio nē175 con una mayor renta bruta media de la provincia de Valencia, y en la posiciķn nē305 en la Comunidad Valenciana, el 3013 a nivel Nacional (sin PV y Navarra), abajo se muestra una tabla con las posiciķnes en las que se encuentran los municipios cercanos y con poblaciķn parecida.
| Renta Municipios Cercanos | ||||
| Municipio | Renta Bruta | Pos Prov | Pos Comu | Pos Naci |
| Valencia (Valencia) | 31.655€ | 11 | 12 | 257 |
| Xātiva (Valencia) | 24.497€ | 50 | 76 | 1401 |
| Torre-Pacheco (Murcia) | 20.117€ | 24 | 24 | 3012 |
| Rotglā i Corberā (Valencia) | 20.115€ | 175 | 305 | 3013 |
| Encinas de Abajo (Salamanca) | 20.113€ | 51 | 522 | 3014 |
| Canals (Valencia) | 19.786€ | 189 | 330 | 3183 |
| la Granja de la Costera (Valencia) | 19.511€ | 197 | 348 | 3331 |
| Llanera de Ranes (Valencia) | 19.474€ | 200 | 351 | 3347 |
Los habitantes de Rotglā i Corberā liquidaron 1.197.558€ en concepto de IRPF en el aņo 2019 y recibieron por parte de las diferentes administraciones de forma directa en el presupuesto municipal (capitulo 4 Y 7) 832.821€ un 69,54% de lo aportado, en la siguiente tabla podemos ver las cifras de los municipios cercanos o de poblaciķn similar.
| Liquidaciķn IPRF vs Presupuesto Ayuntamiento | |||
| Municipio | Liquidaciķn | Capitulo 4 y 7 Presupuesto | % |
| Valencia (Valencia) | 2.054.470.877€ | 356.948.387€ | 17,37 % |
| Xātiva (Valencia) | 45.237.043€ | 11.045.799€ | 24,42 % |
| Torre-Pacheco (Murcia) | 31.965.142€ | 19.842.954€ | 62,08 % |
| Rotglā i Corberā (Valencia) | 1.197.558€ | 832.821€ | 69,54 % |
| Encinas de Abajo (Salamanca) | 441.945€ | 251.575€ | 56,92 % |
| Canals (Valencia) | 11.215.940€ | 5.056.702€ | 45,08 % |
| la Granja de la Costera (Valencia) | 282.577€ | 196.098€ | 69,40 % |
| Llanera de Ranes (Valencia) | 778.598€ | 684.974€ | 87,98 % |
Indicadores de desigualdad.
Íntimamente ligado a la pobreza se halla el concepto de desigualdad. Para entender mejor cķmo afecta a la distribuciķn de la renta en Rotglā i Corberā, mostramos los valores de dos de los indicadores habituales encargados de reflejarla, el ratio 80/20 y el Índice de Gini.
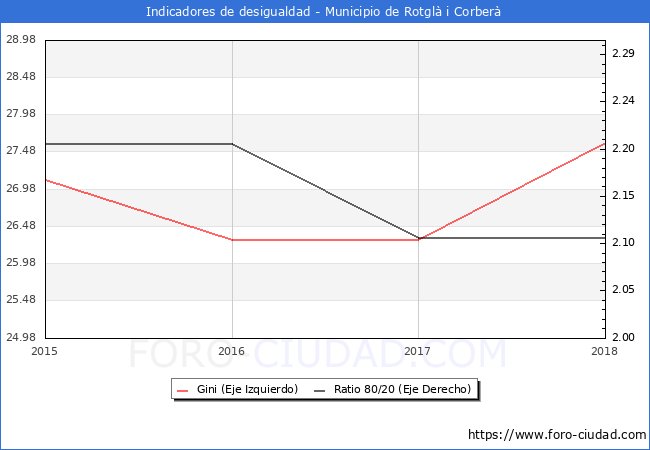
En el aņo 2018 el Indice de Gini para Rotglā i Corberā era de 27.60 y el ratio 80/20 era de 2.10.

Ratio 80/20 Cociente entre los ingresos totales del 20% de las personas con ingresos más elevados (percentil 80) y los ingresos totales del 20% de la poblaciķn con menos ingresos (percentil 20).
El índice de Gini, es utilizado para analizar el grado de inequidad en la distribuciķn respecto a los ingresos. Este indicador toma valores entre cero y uno (o entre 0 y 100 si se da en porcentaje); 0 cuando todas las personas tengan los mismos ingresos (perfecta igualdad), y 1 si todo el ingreso nacional está en manos de una única persona (perfecta desigualdad).
El índice de Gini, es utilizado para analizar el grado de inequidad en la distribuciķn respecto a los ingresos. Este indicador toma valores entre cero y uno (o entre 0 y 100 si se da en porcentaje); 0 cuando todas las personas tengan los mismos ingresos (perfecta igualdad), y 1 si todo el ingreso nacional está en manos de una única persona (perfecta desigualdad).
| Indicadores en otros municipios | ||
| Municipio | Gini | Ratio 80/20 |
| Valencia | 35.40 | 3.20 |
| Xātiva | 31.90 | 2.60 |
| Canals | 28.80 | 2.40 |
| la Granja de la Costera | 25.80 | 2.10 |
| Llanera de Ranes | 29.00 | 2.30 |
(Ir al Índice)
El nē total de Transacciones de vivienda hasta el 3ē Trimestre de 2024 ha sido de 15 un 275.00% mas que en el mismo periodo de 2023 (4).
A continuaciķn se muestra la evoluciķn de los últimos aņos de forma grafica:
Transacciones Inmobiliarias 3ēT 2024
Segun los datos del 3ē Trimestre del 2024 publicados por el Ministerio de Vivienda, el nē de transacciones inmobiliarias en el municipio de Rotglā i Corberā asciende a un total de 5, el 400.00% mas que en el 3T de 2023,de las cuales 0 son transacciones de viviendas nuevas y 5 de segunda mano.El nē total de Transacciones de vivienda hasta el 3ē Trimestre de 2024 ha sido de 15 un 275.00% mas que en el mismo periodo de 2023 (4).
A continuaciķn se muestra la evoluciķn de los últimos aņos de forma grafica:

 |  |  |
(Ir al Índice)


Este grafico no es una imagen fiel de la poblaciķn en edad de trabajar del municipio, debido a que la Seguridad Social, publica los Afiliados por municipio teniendo en cuenta el centro de trabajo y no la residencia del trabajador, por tanto en los municipios como capitales administrativas o municipios dormitorio los datos se alejaran de la realidad por el movimiento de trabajadores entre municipios.
Afiliados a la Seguridad Social a Febrero de 2025 .
| Febrero 2025 | Total Afiliados | Variacion | |||
| Mensual | Anual | ||||
| Absoluta | Relativa | Absoluta | Relativa | ||
| Total | 215 | -9 | -4.02 % | -62 | -22.38 % |
| REGIMEN: | |||||
| GENERAL | 112 | -3 | -2.61 % | -52 | -31.71 % |
| AUTONOMOS | 101 | 0 | 0 % | -3 | -2.88 % |
| AGRARIO | <5 | - | 0 % | - | 0 % |
| HOGAR | <5 | - | 0 % | - | 0 % |
| MAR | 0 | 0 | 0 % | 0 | 0 % |
| CARBON | 0 | 0 | 0 % | 0 | 0 % |

| Afiliaciķn en otros municipios | ||
| Municipio | Afiliados | Dif. Mes Ant. |
| Valencia | 464.626 | 6.068 |
| Xātiva | 10.977 | 280 |
| Canals | 2.974 | 22 |
| la Granja de la Costera | 78 | -53 |
| Llanera de Ranes | 282 | 0 |

 |  |  |
(Ir al Índice)
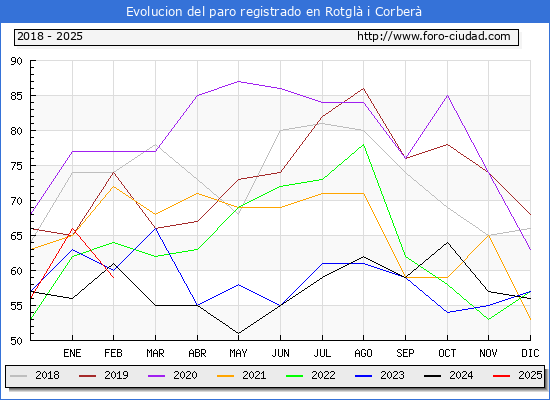
El número total de parados es de 59, de los cuales 21 son hombres y 31 mujeres.
Las personas mayores de 45 aņos con 30 parados son el grupo de edad mas afectado por el paro, seguido de los que se encuentran entre 25 y 44 aņos con 22 parados, el grupo menos numeroso son los menores de 25 aņos con 0 parados.
Por sectores vemos que en la construcciķn es donde mayor número de parados existe en el municipio con <5 personas, seguido de el sector servicios con 44 parados, las personas sin empleo anterior con 6 parados, la industria con 5 parados y por ultimo la agricultura con 0 parados.
Paro registrado a Febrero de 2025.
Segun los datos publicados por el SEPE en el mes de Febrero el número de parados ha bajado en 7 personas. De las 7 personas que salieron de la lista del paro en Rotglā i Corberā descendio en 6 hombres y 5 mujeres.El número total de parados es de 59, de los cuales 21 son hombres y 31 mujeres.
Las personas mayores de 45 aņos con 30 parados son el grupo de edad mas afectado por el paro, seguido de los que se encuentran entre 25 y 44 aņos con 22 parados, el grupo menos numeroso son los menores de 25 aņos con 0 parados.
Por sectores vemos que en la construcciķn es donde mayor número de parados existe en el municipio con <5 personas, seguido de el sector servicios con 44 parados, las personas sin empleo anterior con 6 parados, la industria con 5 parados y por ultimo la agricultura con 0 parados.
| Febrero 2025 | Total Parados | Variacion | |||
| Mensual | Anual | ||||
| Absoluta | Relativa | Absoluta | Relativa | ||
| Total | 59 | -7 | -10.61 % | -2 | -3.28 % |
| HOMBRES | 21 | -6 | -22.22 % | -10 | -32.26 % |
| MUJERES | 31 | -5 | -13.89 % | +3 | 10.71 % |
| MENORES DE 25 AÑOS: | 0 | - | 0 % | - | 0 % |
| HOMBRES | <5 | - | 0 % | - | 0 % |
| MUJERES | <5 | - | 0 % | - | 0 % |
| ENTRE 25 Y 44 AÑOS | 22 | -5 | -18.52 % | +2 | 10.00 % |
| HOMBRES | 13 | +97 | 646.67 % | +6 | 85.71 % |
| MUJERES | 9 | -3 | -25.00 % | -4 | -30.77 % |
| MAYORES DE 45 AÑOS | 30 | -1 | -3.23 % | -1 | -3.23 % |
| HOMBRES | 8 | +1 | 14.29 % | -8 | -50.00 % |
| MUJERES | 22 | -2 | -8.33 % | +7 | 46.67 % |
| SECTOR: | |||||
| AGRICULTURA | 0 | 0 | 0 % | 0 | 0 % |
| INDUSTRIA | 5 | -3 | -37.50 % | -1 | -16.67 % |
| CONSTRUCCIÓN | <5 | - | 0 % | - | 0 % |
| SERVICIOS | 44 | -4 | -8.33 % | -1 | -2.22 % |
| SIN EMPLEO ANTERIOR | 6 | +1 | 20.00 % | +6 | 100.00 % |

 |  |  |
(Ir al Índice)
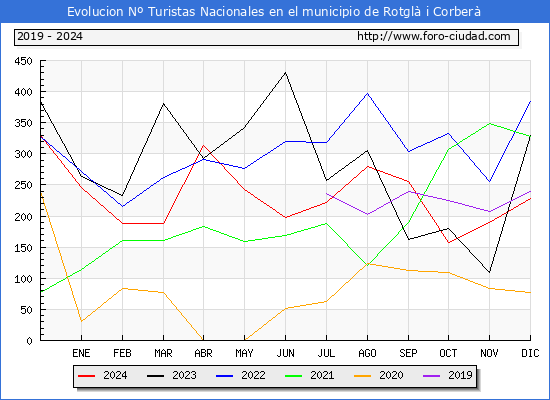
Los turistas de origen internacional ascendieron a 45 un -31,8% menos que en el mismo mes de 2023 y el nē de turistas nacionales fue de 228 un -30,9% menos.
El nē total de turistas que han visitado Rotglā i Corberā de Enero a Diciembre de 2024 ha sido de 3.443 un -14,8% menos que en el mismo periodo de 2023,el total de turistas de origen nacional ha sido de 2.707 (-17,6%) y los de origen internacional 736 (-2,6%).

Estadisticas turísticas a Diciembre de 2024.
En Diciembre de 2024 el Nē de turistas que visitaron* Rotglā i Corberā fue de 273 un -31,1% menos que en Diciembre de 2023.Los turistas de origen internacional ascendieron a 45 un -31,8% menos que en el mismo mes de 2023 y el nē de turistas nacionales fue de 228 un -30,9% menos.
El nē total de turistas que han visitado Rotglā i Corberā de Enero a Diciembre de 2024 ha sido de 3.443 un -14,8% menos que en el mismo periodo de 2023,el total de turistas de origen nacional ha sido de 2.707 (-17,6%) y los de origen internacional 736 (-2,6%).


| Estadísticas turísticas en otros municipios | |||
| Municipio | Total Turistas Diciembre 2024 | Diferencia Diciembre 2023 | Top |
| Valencia | 312.028 | +13.273 (4,4%) | 4 |
| Xātiva | 5.747 | -344 (-5,6%) | 514 |
| Canals | 1.204 | -4 (-0,3%) | 2.107 |
| Llanera de Ranes | 122 | -29 (-19,2%) | 5.759 |
*:Se consideran viajes turísticos todos los desplazamientos con destino principal fuera del lugar de residencia habitual de la persona, que implique una pernoctaciķn fuera del mismo.
 |  |  |
(Ir al Índice)
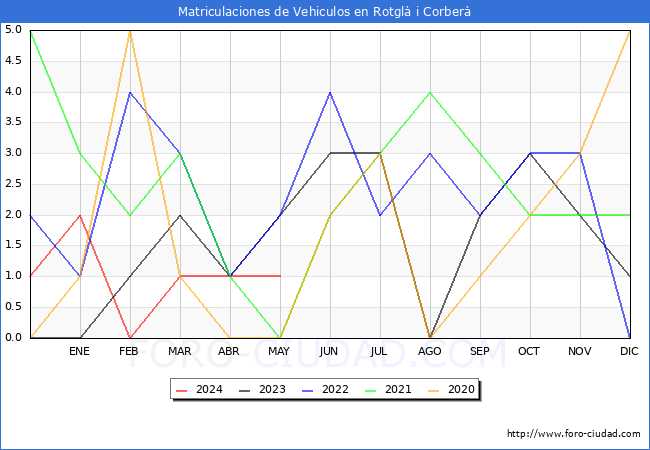
Matriculaciones vehículos en Mayo de 2024 .
| Matriculaciones | Mayo 2024 | Mayo 2023 | 12 Meses Interanual | 12 Meses Anteriores | ||||
| Mat | Dif | % | Mat | Dif | % | |||
| TOTAL | 1 | 2 | -1 | -50.00 % | 19 | 23 | -4 | -17.39 % |
| TURISMOS | 0 | 0 | 0 | 0.00 % | 9 | 13 | -4 | -30.77 % |
| CAMIONES | 0 | 1 | -1 | -100.00 % | 1 | 2 | -1 | -50.00 % |
| AUTOBUSES | 0 | 0 | 0 | 0.00 % | 0 | 0 | 0 | 0.00 % |
| CAMIONETAS | 0 | 0 | 0 | 0.00 % | 1 | 0 | +1 | 100.00 % |
| TRACTORES | 0 | 0 | 0 | 0.00 % | 1 | 1 | 0 | 0.00 % |
| MOTOCICLETAS | 1 | 1 | 0 | 0.00 % | 4 | 3 | +1 | 33.33 % |
| CICLOMOTORES | 0 | 0 | 0 | 0.00 % | 2 | 2 | 0 | 0.00 % |
| OTROS | 0 | 0 | 0 | 0.00 % | 1 | 2 | -1 | -50.00 % |
| Matriculaciones en otros municipios | ||
| Municipio | Matriculaciones Mayo 2024 | Diferencia Mayo 2023 |
| Valencia | 1.572 | -7 (-0.44%) |
| Xātiva | 63 | -29 (-31.52%) |
| Canals | 17 | -10 (-37.04%) |
| la Granja de la Costera | 2 | +2 (100.00%) |
| Llanera de Ranes | 4 | 0 (0.00%) |

 |  |  |
Elaboracion:Foro-ciudad.com (Se puede usar todo el contenido, insertando link a esta pagina).
Fuentes:
Instituto Nacional de Estadística
1900-1981: Poblaciones de hecho desde 1900 hasta 1991. Cifras oficiales sacadas de los Censos respectivos.
1986-1995: Poblaciones de derecho desde 1986 hasta 1995. Cifras de las rectificaciones y renovaciones Padrķnales.
1996-2024: Cifras Oficiales de Poblaciķn de los Municipios Espaņoles:Revisiķn del Padrķn Municipal.
Mediciķn del turismo a partir de la posiciķn de los teléfonos mķviles.
Ministerio de Hacienda y Administraciones Públicas
Agencia Tributaria
Servicio Público de Empleo Estatal
Seguridad Social
Ministerio de Fomento
DGT
Catastro *Datos no disponibles para Navarra y Pais Vasco.


