Demografia de Llanera de Ranes
Esta información pretende ofrecer una visión actual de la información demográfica puesta a disposición por el INE a través de sus diferentes publicaciones estadísticas, sobre todo usando como fuente el Padrón Municipal que se actualiza anualmente.
Mapa edad edificaciones
Evolución población 1900 hasta 2024
Habitantes segun lugar de nacimiento
Pirámide de población
Crecimiento Natural o Vegetativo
Numero de Matrimonios
Residentes en el Extranjero
Estadística del IRPF
Transacciones Inmobiliarias 3º Trimestre de 2024
Afiliados a la Seguridad Social a Febrero de 2025
Paro registrado a Febrero de 2025
Estadisticas Turismo a Diciembre de 2024
Matriculaciones vehículos en Mayo de 2024
Habitantes por Localidad
Habitantes en municipios cercanos
Habitantes provincia de Valencia 2024
(Ir al Índice)Evolución población 1900 hasta 2024
Habitantes segun lugar de nacimiento
Pirámide de población
Crecimiento Natural o Vegetativo
Numero de Matrimonios
Residentes en el Extranjero
Estadística del IRPF
Transacciones Inmobiliarias 3º Trimestre de 2024
Afiliados a la Seguridad Social a Febrero de 2025
Paro registrado a Febrero de 2025
Estadisticas Turismo a Diciembre de 2024
Matriculaciones vehículos en Mayo de 2024
Habitantes por Localidad
Habitantes en municipios cercanos
Habitantes provincia de Valencia 2024
Mapa edad edificaciones.
En el siguiente mapa se puede observar la edad de los edificios de Llanera de Ranes, los datos provienen del Catastro y están actualizados a Octubre de 2019 .

Cada color representa una década, excepto el Negro que representa todos los edificios anteriores a 1900,que suele ser el casco histórico, en el mapa puede apreciarse como ha sido el desarrollo urbanístico de Llanera de Ranes a lo largo del tiempo.
En la tabla posterior podemos ver la cantidad de superficie construida (en m2) por década,así como la posición que ocupa el municipio en un Top nacional y provincial para cada década.
En la tabla posterior podemos ver la cantidad de superficie construida (en m2) por década,así como la posición que ocupa el municipio en un Top nacional y provincial para cada década.
| Superficie Construida | ||||
| Decada | % Total | Top Provincial | Top Nacional* | |
| <1900 | 0.17% | <- 229º -> | <- 4871º -> | |
| 1900-1909 | 18.53% | <- 52º -> | <- 1795º -> | |
| 1910-1919 | 0.31% | <- 193º -> | <- 3909º -> | |
| 1920-1929 | 10.15% | <- 80º -> | <- 1214º -> | |
| 1930-1939 | 1.75% | <- 212º -> | <- 3926º -> | |
| 1940-1949 | 1.36% | <- 216º -> | <- 5125º -> | |
| 1950-1959 | 1.12% | <- 223º -> | <- 5356º -> | |
| 1960-1969 | 4.40% | <- 202º -> | <- 3628º -> | |
| 1970-1979 | 10.20% | <- 198º -> | <- 3130º -> | |
| 1980-1989 | 9.77% | <- 201º -> | <- 3573º -> | |
| 1990-1999 | 7.65% | <- 191º -> | <- 3464º -> | |
| 2000-2009 | 31.62% | <- 146º -> | <- 2179º -> | |
| 2010-2019 | 2.98% | <- 164º -> | <- 2956º -> | |


(Ir al Índice)
Evolución de la población desde 1900 hasta 2024.
Segun los datos publicados por el INE a 1 de Enero de 2024 el número de habitantes en Llanera de Ranes es de 1.057, 3 habitantes mas que el en el año 2023. En el grafico siguiente se puede ver cuantos habitantes tiene Llanera de Ranes a lo largo de los años.
| Habitantes en otros municipios | ||
| Municipio | Habitantes | Diferencia (2023) |
| Valencia | 825.948 | +18.255 |
| Canals | 13.415 | +253 |
| Xàtiva | 30.378 | +306 |
| Torrella | 150 | +7 |
| Cerdà | 367 | +7 |
Actualmente la densidad de poblacion en Llanera de Ranes es de 113,98 habitantes por Km2.
Tabla con la evolución del número de hombres ,mujeres y total a lo largo de los años.
| Evolución de la población desde 1900 hasta 2024 | |||
| Año | Hombres | Mujeres | Total |
| 2024 | 540 | 517 | 1.057 |
| 2023 | 540 | 514 | 1.054 |
| 2022 | 552 | 514 | 1.066 |
| 2021 | 548 | 508 | 1.056 |
| 2020 | 533 | 514 | 1.047 |
| 2019 | 529 | 526 | 1.055 |
| 2018 | 525 | 524 | 1.049 |
| 2017 | 528 | 514 | 1.042 |
| 2016 | 525 | 521 | 1.046 |
| 2015 | 532 | 526 | 1.058 |
| 2014 | 523 | 512 | 1.035 |
| 2013 | 572 | 526 | 1.098 |
| 2012 | 596 | 547 | 1.143 |
| 2011 | 605 | 554 | 1.159 |
| 2010 | 583 | 536 | 1.119 |
| 2009 | 569 | 538 | 1.107 |
| 2008 | 573 | 525 | 1.098 |
| 2007 | 560 | 517 | 1.077 |
| 2006 | 538 | 526 | 1.064 |
| 2005 | 545 | 511 | 1.056 |
| 2004 | 555 | 504 | 1.059 |
| 2003 | 619 | 492 | 1.111 |
| 2002 | 640 | 496 | 1.136 |
| 2001 | 584 | 488 | 1.072 |
| 2000 | 510 | 482 | 992 |
| 1999 | 532 | 499 | 1.031 |
| 1998 | 518 | 495 | 1.013 |
| 1996 | 527 | 529 | 1.056 |
| 1995 | 503 | 501 | 1.004 |
| 1994 | 500 | 502 | 1.002 |
| 1993 | 485 | 490 | 975 |
| 1992 | 480 | 483 | 963 |
| 1991 | 484 | 482 | 966 |
| 1990 | 485 | 485 | 970 |
| 1989 | 483 | 477 | 960 |
| 1988 | 480 | 479 | 959 |
| 1987 | 493 | 476 | 969 |
| 1986 | 486 | 474 | 960 |
| 1981 | 0 | 0 | 959 |
| 1970 | 0 | 0 | 1.005 |
| 1960 | 0 | 0 | 945 |
| 1950 | 0 | 0 | 976 |
| 1940 | 0 | 0 | 907 |
| 1930 | 0 | 0 | 922 |
| 1920 | 0 | 0 | 939 |
| 1910 | 0 | 0 | 988 |
| 1900 | 0 | 0 | 890 |
(Ir al Índice)
Poblacion Máxima Estacional.
La población estacional máxima es una estimación de la población máxima que soporta Llanera de Ranes. En el cálculo se incluyen las personas que tienen algún tipo de vinculación o relación con el municipio, ya sea porque residen, trabajan, estudian o pasan algún período de tiempo en él. Los datos son publicados anualmente por el Ministerio de Hacienda y Administraciones Públicas, en colaboración con las Diputaciones Provinciales, Cabildos y Consejos Insulares.| Poblacion Estacional Máxima | |||
| Año | Personas | ||
| 2016 | 1.458 | ||
| 2015 | 1.458 | ||
| 2014 | 1.470 | ||
| 2013 | 1.451 | ||
| 2012 | 1.365 | ||
| 2011 | 1.348 | ||
| 2010 | 1.327 | ||
| 2009 | 1.137 | ||
| 2008 | 1.069 | ||
| 2005 | 1.107 | ||
| 2000 | 1.078 | ||
(Ir al Índice)
Habitantes segun lugar de nacimiento.
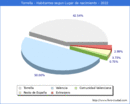
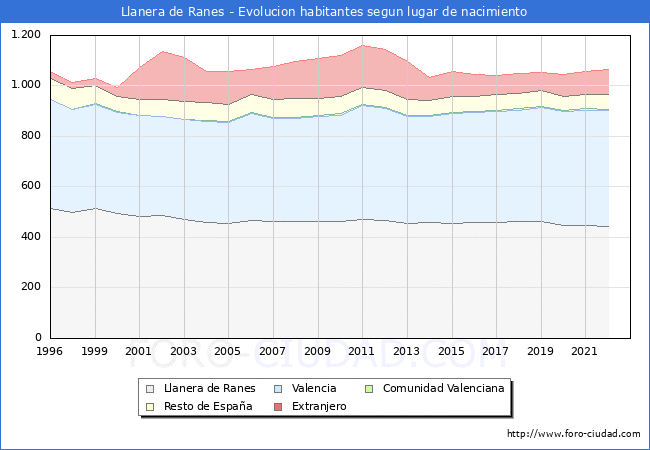
Según los datos publicados por el INE procedentes del padrón municipal de 2022 el 41.37% (441) de los habitantes empadronados en el Municipio de Llanera de Ranes han nacido en dicho municipio, el 49.06% han emigrado a Llanera de Ranes desde diferentes lugares de España, el 43.34% (462) desde otros municipios de la provincia de Valencia, el 0.28% (3) desde otras provincias de la Comunidad Valenciana, el 5.44% (58) desde otras comunidades autónomas y el 9.57% (102) han emigrado a Llanera de Ranes desde otros países.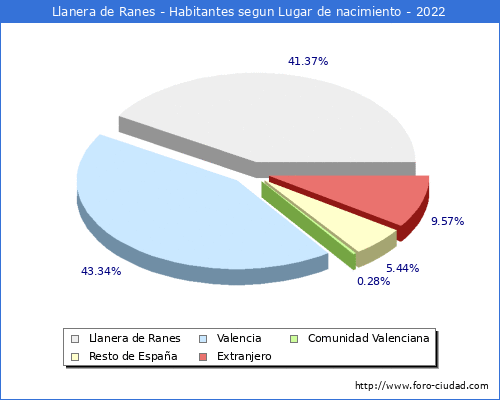
 |  |  |
En el siguiente gráfico podemos ver la evolución de la estructura de la población en el municipio de Llanera de Ranes si lo comparamos con 2021 vemos
- Disminuyen (-4) los habitantes nacidos en Llanera de Ranes, pasando del 42.14% al 41.37%.
- Aumentan (3) los habitantes nacidos en la provincia de Valencia, pasando del 43.47% al 43.34%.
- Disminuyen (-2) los habitantes nacidos en la Comunidad Valenciana, pasando del 0.47% al 0.28%.
- Aumentan (1) los habitantes nacidos en el resto de España, pasando del 5.40% al 5.44%.
- Aumentan (12) los habitantes nacidos en otros países, pasando del 8.52% al 9.57%.
- Disminuyen (-71) los habitantes nacidos en Llanera de Ranes, pasando del 48.48% al 41.37%.
- Aumentan (28) los habitantes nacidos en la provincia de Valencia, pasando del 41.10% al 43.34%.
- Aumentan (2) los habitantes nacidos en la la Comunidad Valenciana, pasando del 0.09% al 0.28%.
- Disminuyen (-25) los habitantes nacidos en el resto de España, pasando del 7.86% al 5.44%.
- Aumentan (76) los habitantes nacidos en otros países, pasando del 2.46% al 9.57%.
| | | |
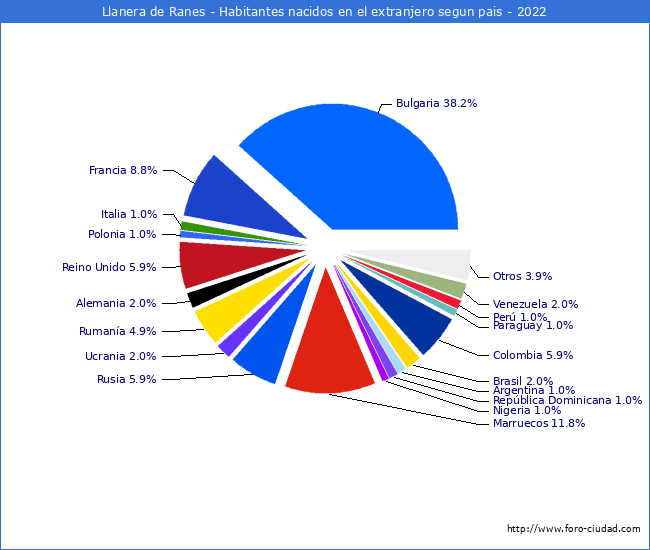
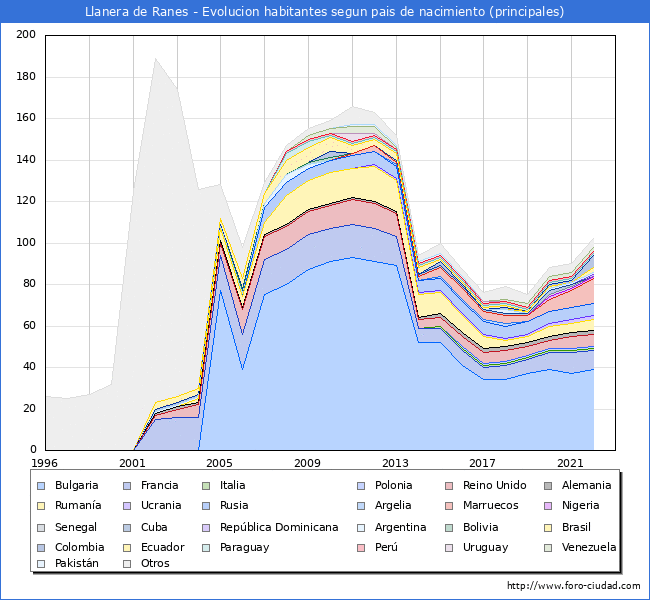
Segun los datos ofrecidos por el INE en la estadistica del Padrón los habitantes empadronados en Llanera de Ranes que han nacido en otros países ascienden a 102.
- 16 habitantes, 5 hombres y 11 mujeres nacidos en América.
- 15 habitantes, 7 hombres y 8 mujeres nacidos en África.
| | | |
| Habitantes segun Pais de Nacimiento | |||
| Pais | 2022 | Dif (2021) | |
| Bulgaria | 39 | 2 | |
| Francia | 9 | -1 | |
| Italia | 1 | 0 | |
| Polonia | 1 | 0 | |
| Reino Unido | 6 | 0 | |
| Alemania | 2 | 0 | |
| Rumanía | 5 | 1 | |
| Ucrania | 2 | 0 | |
| Rusia | 6 | 0 | |
| Marruecos | 12 | 4 | |
| Nigeria | 1 | 0 | |
| República Dominicana | 1 | 1 | |
| Argentina | 1 | 0 | |
| Brasil | 2 | 2 | |
| Colombia | 6 | 5 | |
| Paraguay | 1 | 0 | |
| Perú | 1 | 0 | |
| Venezuela | 2 | 0 | |
| Otros | 4 | 0 | |
| | | |
Teniendo en cuenta la proporción de habitantes nacidos en otro pais sobre la población total del municipio, hemos realizado un ranking, en el que la 1ª posición esta ocupada por el municipio con una proporción mayor de habitantes nacidos en otro pais, aquí puede verse en que lugar esta el municipio de Llanera de Ranes y sus municipios cercanos.
| Top Municipal % Habitantes nacidos en otro pais | |||
| Provincia | Municipio | Pos | % |
| Huesca | Sangarrén | 1.519 | 14,61 |
| Valladolid | La Unión de Campos | 3.034 | 9,57 |
| Valencia | Llanera de Ranes | 3.035 | 9,57 |
| Leon | Matadeón de los Oteros | 3.036 | 9,57 |
| Valencia | Rotglà i Corberà | 3.651 | 8,00 |
| Valencia | Cerdà | 4.207 | 6,84 |
| Valencia | Novelé/Novetlè | 4.333 | 6,62 |
| Valencia | Vallés | 5.473 | 4,64 |
| Valencia | la Granja de la Costera | 6.121 | 3,62 |
| Valencia | Torrella | 6.530 | 2,99 |
| | | |
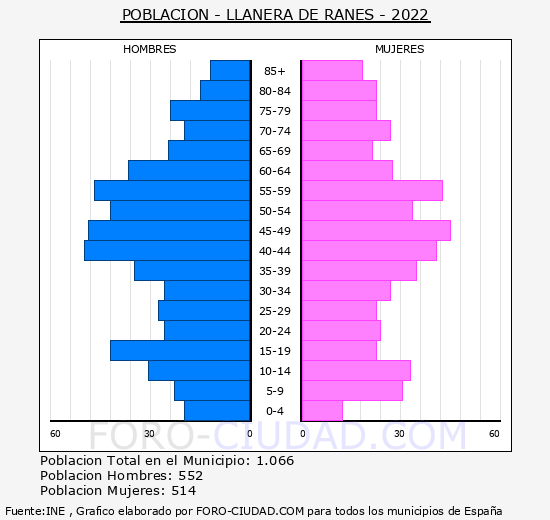
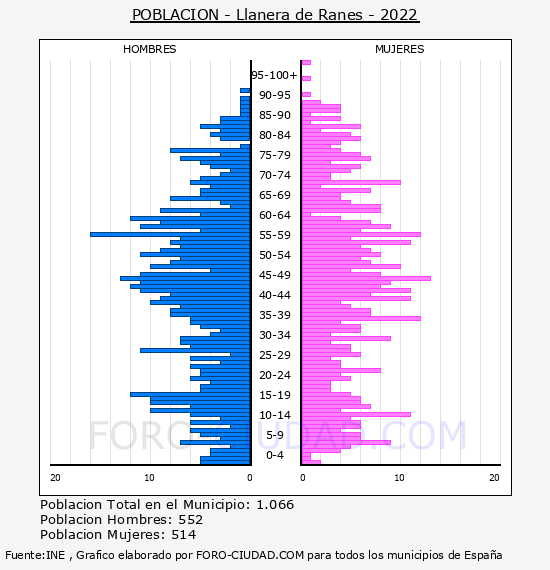
La media de edad de los habitantes de Llanera de Ranes es de 43,53 años, 0,46 años mas que hace un lustro que era de 43,07 años.
| Población de Llanera de Ranes por sexo y edad 2022 (grupos quinquenales) | |||
| Edad | Hombres | Mujeres | Total |
| 0-5 | 20 | 13 | 33 |
| 5-10 | 23 | 31 | 54 |
| 10-15 | 31 | 33 | 64 |
| 15-20 | 42 | 23 | 65 |
| 20-25 | 26 | 24 | 50 |
| 25-30 | 28 | 23 | 51 |
| 30-35 | 26 | 27 | 53 |
| 35-40 | 35 | 35 | 70 |
| 40-45 | 50 | 41 | 91 |
| 45-50 | 49 | 45 | 94 |
| 50-55 | 42 | 34 | 76 |
| 55-60 | 47 | 43 | 90 |
| 60-65 | 37 | 28 | 65 |
| 65-70 | 25 | 22 | 47 |
| 70-75 | 20 | 27 | 47 |
| 75-80 | 24 | 23 | 47 |
| 80-85 | 15 | 23 | 38 |
| 85- | 12 | 19 | 31 |
| Total | 552 | 514 | 1.066 |
La poblacion menor de 18 años en Llanera de Ranes es de 200 (106 H, 94 M ), el 18,8%.
La poblacion entre 18 y 65 años en Llanera de Ranes es de 664 (353 H, 311 M ), el 62,3%.
La poblacion mayor de 65 años en Llanera de Ranes es de 202 (93 H, 109 M ), el 18,9%.
| | | |
(Ir al Índice)
Crecimiento Natural o Vegetativo.
El crecimiento natural de la población en el municipio de Llanera de Ranes, según los últimos datos publicados por el INE para el año 2022 ha sido Negativo, con 5 defunciones mas que nacimientos.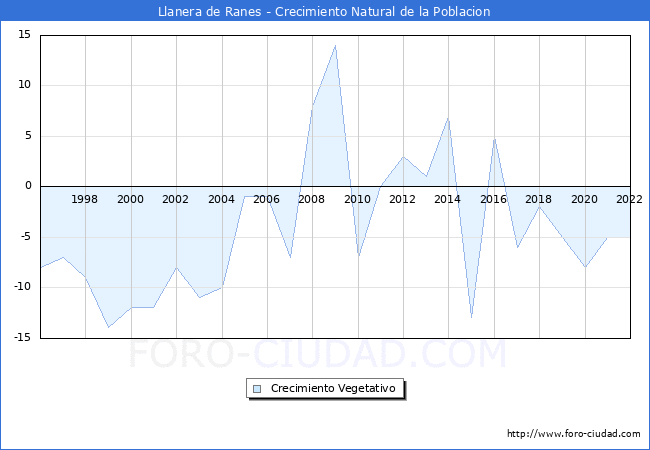
| | | |
Tabla con la evolución del número de nacimientos , defunciones y crecimiento vegetativo.
| Evolución Nacimientos y Defunciones desde 1996 hasta 2022 | |||
| Año | Nacimientos | Fallecidos | Diferencia |
| 2022 | 4 | 9 | -5 |
| 2021 | 8 | 13 | -5 |
| 2020 | 4 | 12 | -8 |
| 2019 | 6 | 11 | -5 |
| 2018 | 8 | 10 | -2 |
| 2017 | 7 | 13 | -6 |
| 2016 | 16 | 11 | 5 |
| 2015 | 2 | 15 | -13 |
| 2014 | 17 | 10 | 7 |
| 2013 | 13 | 12 | 1 |
| 2012 | 14 | 11 | 3 |
| 2011 | 16 | 16 | 0 |
| 2010 | 11 | 18 | -7 |
| 2009 | 24 | 10 | 14 |
| 2008 | 17 | 9 | 8 |
| 2007 | 13 | 20 | -7 |
| 2006 | 12 | 13 | -1 |
| 2005 | 12 | 13 | -1 |
| 2004 | 7 | 17 | -10 |
| 2003 | 5 | 16 | -11 |
| 2002 | 8 | 16 | -8 |
| 2001 | 9 | 21 | -12 |
| 2000 | 7 | 19 | -12 |
| 1999 | 7 | 21 | -14 |
| 1998 | 10 | 19 | -9 |
| 1997 | 9 | 16 | -7 |
| 1996 | 9 | 17 | -8 |
(Ir al Índice)
Evolución número de Matrimonios.
En el siguiente grafico y tabla podemos ver la evolución en el número de matrimonios que se han otorgado en el Municipio de Llanera de Ranes hasta el año 2022.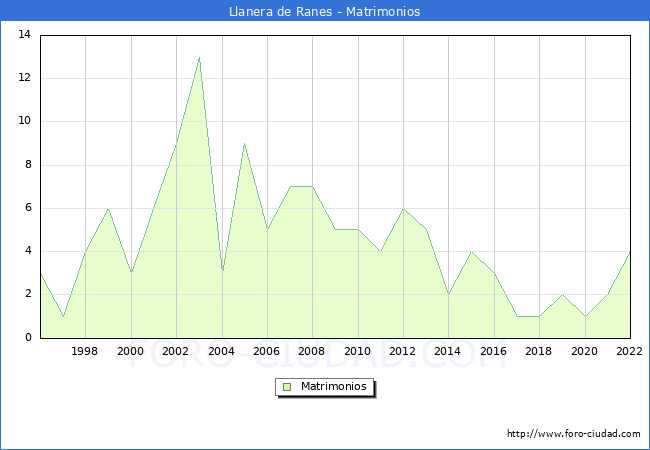
| | | |
| Evolución Matrimonios desde 1996 hasta 2022 | |
| Año | Matrimonios |
| 2022 | 4 |
| 2021 | 2 |
| 2020 | 1 |
| 2019 | 2 |
| 2018 | 1 |
| 2017 | 1 |
| 2016 | 3 |
| 2015 | 4 |
| 2014 | 2 |
| 2013 | 5 |
| 2012 | 6 |
| 2011 | 4 |
| 2010 | 5 |
| 2009 | 5 |
| 2008 | 7 |
| 2007 | 7 |
| 2006 | 5 |
| 2005 | 9 |
| 2004 | 3 |
| 2003 | 13 |
| 2002 | 9 |
| 2001 | 6 |
| 2000 | 3 |
| 1999 | 6 |
| 1998 | 4 |
| 1997 | 1 |
| 1996 | 3 |
(Ir al Índice)
Residentes en el extranjero.
Segun los datos publicados por el INE en el CERA, Censo Electoral de españoles residentes en el extranjero a 1 de Noviembre de 2024 los los españoles que residen habitualmente en el extranjero o han trasladado al extranjero su residencia habitual mayores de 18 años eran 37 personas con municipio de origen en Llanera de Ranes.
| | | |
(Ir al Índice)
En 2019 Llanera de Ranes se sitúa como el municipio nº200 con una mayor renta bruta media de la provincia de Valencia, y en la posición nº351 en la Comunidad Valenciana, el 3347 a nivel Nacional (sin PV y Navarra), abajo se muestra una tabla con las posiciónes en las que se encuentran los municipios cercanos y con población parecida.
Los habitantes de Llanera de Ranes liquidaron 778.598€ en concepto de IRPF en el año 2019 y recibieron por parte de las diferentes administraciones de forma directa en el presupuesto municipal (capitulo 4 Y 7) 684.974€ un 87,98% de lo aportado, en la siguiente tabla podemos ver las cifras de los municipios cercanos o de población similar.
Estadística del IRPF
Segun los datos hechos publicos por el Ministerio de Hacienda la renta bruta media por declarante, en el municipio de Llanera de Ranes en 2019 fue de 19.474€, 391€ mas que en el año 2018 . Una vez descontada la liquidacion por IRPF y lo aportado a la Seguridad Social la renta disponible media por declarante se situó en 16.836€, 334€ mas que en el año 2018.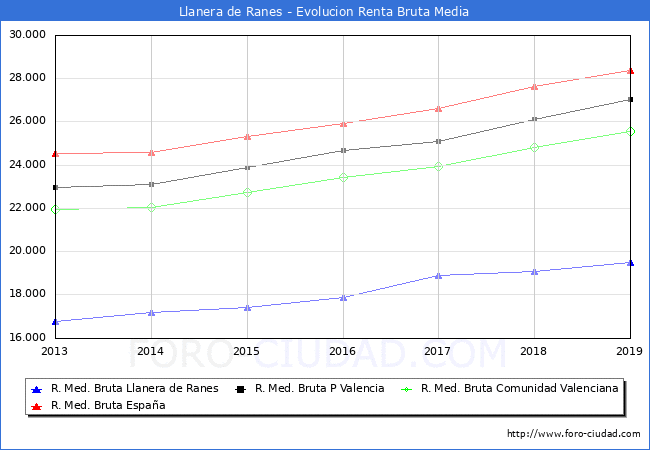
| | | |
| Evolución de la Renta Media en Llanera de Ranes | ||||
| Año | Renta Bruta | Var | Renta Dispo | Var |
| 2019 | 19.474€ | 391€ (2,01%) | 16.836€ | 334€ (1,98%) |
| 2018 | 19.083€ | 191€ (1,00%) | 16.502€ | 260€ (1,58%) |
| 2017 | 18.892€ | 1.027€ (5,44%) | 16.242€ | 650€ (4,00%) |
| 2016 | 17.865€ | 442€ (2,47%) | 15.592€ | 517€ (3,32%) |
| 2015 | 17.423€ | 244€ (1,40%) | 15.075€ | 333€ (2,21%) |
| 2014 | 17.179€ | 427€ (2,49%) | 14.742€ | 268€ (1,82%) |
| 2013 | 16.752€ | 0€ (0,00%) | 14.474€ | 0€ (0,00%) |
En 2019 Llanera de Ranes se sitúa como el municipio nº200 con una mayor renta bruta media de la provincia de Valencia, y en la posición nº351 en la Comunidad Valenciana, el 3347 a nivel Nacional (sin PV y Navarra), abajo se muestra una tabla con las posiciónes en las que se encuentran los municipios cercanos y con población parecida.
| Renta Municipios Cercanos | ||||
| Municipio | Renta Bruta | Pos Prov | Pos Comu | Pos Naci |
| Valencia (Valencia) | 31.655€ | 11 | 12 | 257 |
| Xàtiva (Valencia) | 24.497€ | 50 | 76 | 1401 |
| Cerdà (Valencia) | 19.866€ | 186 | 320 | 3142 |
| Canals (Valencia) | 19.786€ | 189 | 330 | 3183 |
| Fuencemillán (Guadalajara) | 19.479€ | 93 | 255 | 3346 |
| Llanera de Ranes (Valencia) | 19.474€ | 200 | 351 | 3347 |
| Talaveruela de la Vera (Caceres) | 19.474€ | 16 | 27 | 3348 |
| Torrella (Valencia) | 18.061€ | 230 | 431 | 4196 |
Los habitantes de Llanera de Ranes liquidaron 778.598€ en concepto de IRPF en el año 2019 y recibieron por parte de las diferentes administraciones de forma directa en el presupuesto municipal (capitulo 4 Y 7) 684.974€ un 87,98% de lo aportado, en la siguiente tabla podemos ver las cifras de los municipios cercanos o de población similar.
| Liquidación IPRF vs Presupuesto Ayuntamiento | |||
| Municipio | Liquidación | Capitulo 4 y 7 Presupuesto | % |
| Valencia (Valencia) | 2.054.470.877€ | 356.948.387€ | 17,37 % |
| Xàtiva (Valencia) | 45.237.043€ | 11.045.799€ | 24,42 % |
| Cerdà (Valencia) | 280.783€ | 324.600€ | 115,61 % |
| Canals (Valencia) | 11.215.940€ | 5.056.702€ | 45,08 % |
| Fuencemillán (Guadalajara) | 49.085€ | 59.679€ | 121,58 % |
| Llanera de Ranes (Valencia) | 778.598€ | 684.974€ | 87,98 % |
| Talaveruela de la Vera (Caceres) | 254.895€ | 414.443€ | 162,59 % |
| Torrella (Valencia) | 102.255€ | 112.096€ | 109,62 % |
Indicadores de desigualdad.
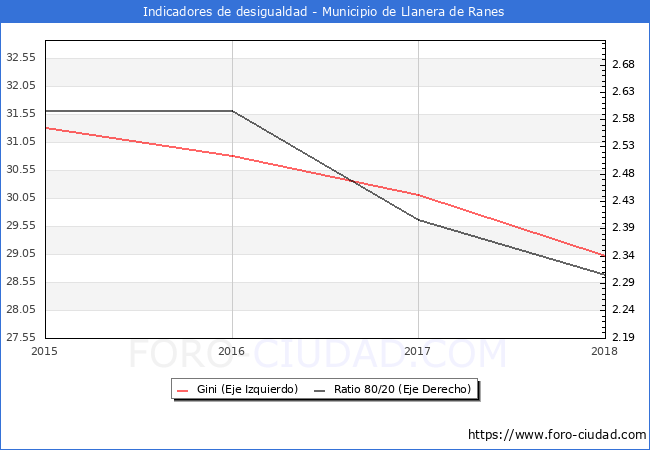
Íntimamente ligado a la pobreza se halla el concepto de desigualdad. Para entender mejor cómo afecta a la distribución de la renta en Llanera de Ranes, mostramos los valores de dos de los indicadores habituales encargados de reflejarla, el ratio 80/20 y el Índice de Gini.
En el año 2018 el Indice de Gini para Llanera de Ranes era de 29.00 y el ratio 80/20 era de 2.30.
Íntimamente ligado a la pobreza se halla el concepto de desigualdad. Para entender mejor cómo afecta a la distribución de la renta en Llanera de Ranes, mostramos los valores de dos de los indicadores habituales encargados de reflejarla, el ratio 80/20 y el Índice de Gini.
En el año 2018 el Indice de Gini para Llanera de Ranes era de 29.00 y el ratio 80/20 era de 2.30.
Ratio 80/20 Cociente entre los ingresos totales del 20% de las personas con ingresos más elevados (percentil 80) y los ingresos totales del 20% de la población con menos ingresos (percentil 20).
El índice de Gini, es utilizado para analizar el grado de inequidad en la distribución respecto a los ingresos. Este indicador toma valores entre cero y uno (o entre 0 y 100 si se da en porcentaje); 0 cuando todas las personas tengan los mismos ingresos (perfecta igualdad), y 1 si todo el ingreso nacional está en manos de una única persona (perfecta desigualdad).
El índice de Gini, es utilizado para analizar el grado de inequidad en la distribución respecto a los ingresos. Este indicador toma valores entre cero y uno (o entre 0 y 100 si se da en porcentaje); 0 cuando todas las personas tengan los mismos ingresos (perfecta igualdad), y 1 si todo el ingreso nacional está en manos de una única persona (perfecta desigualdad).


(Ir al Índice)
El nº total de Transacciones de vivienda hasta el 3º Trimestre de 2024 ha sido de 4 un -60.00% menos que en el mismo periodo de 2023 (10).
A continuación se muestra la evolución de los últimos años de forma grafica:
Transacciones Inmobiliarias 3ºT 2024
Segun los datos del 3º Trimestre del 2024 publicados por el Ministerio de Vivienda, el nº de transacciones inmobiliarias en el municipio de Llanera de Ranes asciende a un total de 3, el 50.00% mas que en el 3T de 2023,de las cuales 0 son transacciones de viviendas nuevas y 3 de segunda mano.El nº total de Transacciones de vivienda hasta el 3º Trimestre de 2024 ha sido de 4 un -60.00% menos que en el mismo periodo de 2023 (10).
A continuación se muestra la evolución de los últimos años de forma grafica:

| | | |
(Ir al Índice)
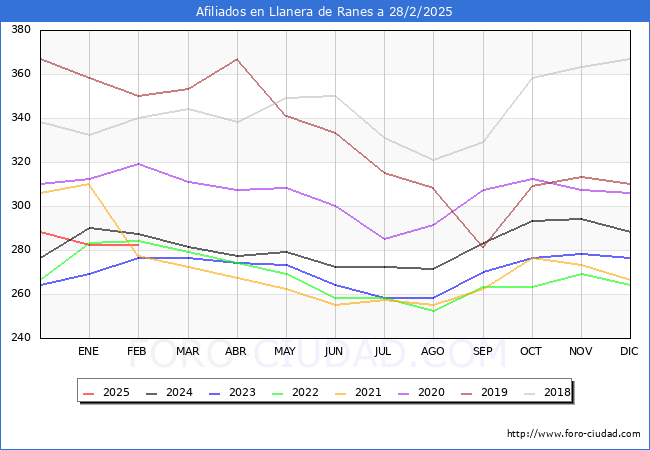
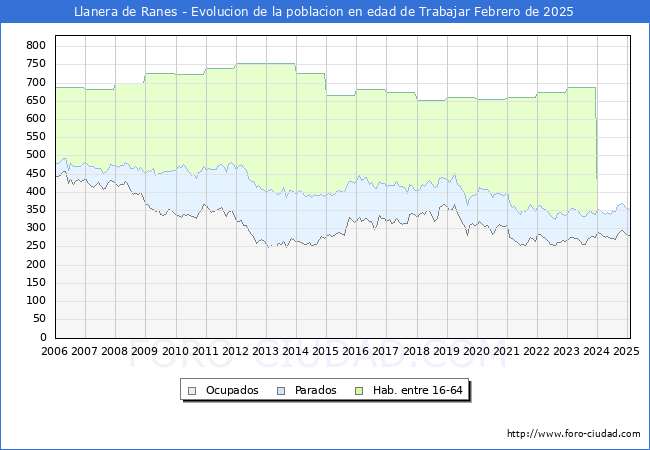
Este grafico no es una imagen fiel de la población en edad de trabajar del municipio, debido a que la Seguridad Social, publica los Afiliados por municipio teniendo en cuenta el centro de trabajo y no la residencia del trabajador, por tanto en los municipios como capitales administrativas o municipios dormitorio los datos se alejaran de la realidad por el movimiento de trabajadores entre municipios.
Afiliados a la Seguridad Social a Febrero de 2025 .
| Febrero 2025 | Total Afiliados | Variacion | |||
| Mensual | Anual | ||||
| Absoluta | Relativa | Absoluta | Relativa | ||
| Total | 282 | 0 | 0 % | -5 | -1.74 % |
| REGIMEN: | |||||
| GENERAL | 196 | -1 | -0.51 % | -4 | -2.00 % |
| AUTONOMOS | 75 | 0 | 0 % | -2 | -2.60 % |
| AGRARIO | 10 | +1 | 11.11 % | 0 | 0 % |
| HOGAR | <5 | - | 0 % | - | 0 % |
| MAR | 0 | 0 | 0 % | 0 | 0 % |
| CARBON | 0 | 0 | 0 % | 0 | 0 % |
| Afiliación en otros municipios | ||
| Municipio | Afiliados | Dif. Mes Ant. |
| Valencia | 464.626 | 6.068 |
| Canals | 2.974 | 22 |
| Xàtiva | 10.977 | 280 |
| Torrella | 23 | 1 |
| Cerdà | 77 | -1 |
| | | |
(Ir al Índice)
El número total de parados es de 71, de los cuales 31 son hombres y 38 mujeres.
Las personas mayores de 45 años con 39 parados son el grupo de edad mas afectado por el paro, seguido de los que se encuentran entre 25 y 44 años con 22 parados, el grupo menos numeroso son los menores de 25 años con 8 parados.
Por sectores vemos que en la agricultura es donde mayor número de parados existe en el municipio con <5 personas, seguido de el sector servicios con 42 parados, la industria con 13 parados, las personas sin empleo anterior con 8 parados y por ultimo la construcción con 7 parados.
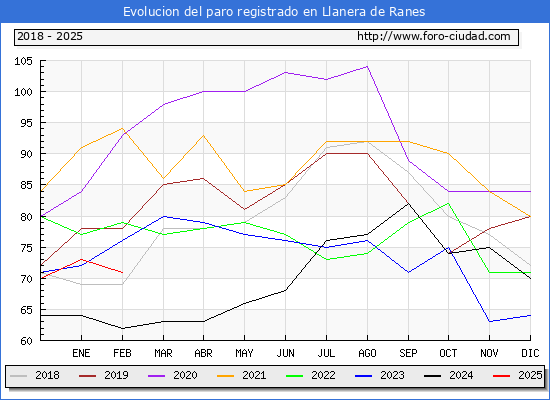
Paro registrado a Febrero de 2025.
Segun los datos publicados por el SEPE en el mes de Febrero el número de parados ha bajado en 2 personas. De las 2 personas que salieron de la lista del paro en Llanera de Ranes descendio en 2 hombres y no vario entre las mujeres.El número total de parados es de 71, de los cuales 31 son hombres y 38 mujeres.
Las personas mayores de 45 años con 39 parados son el grupo de edad mas afectado por el paro, seguido de los que se encuentran entre 25 y 44 años con 22 parados, el grupo menos numeroso son los menores de 25 años con 8 parados.
Por sectores vemos que en la agricultura es donde mayor número de parados existe en el municipio con <5 personas, seguido de el sector servicios con 42 parados, la industria con 13 parados, las personas sin empleo anterior con 8 parados y por ultimo la construcción con 7 parados.
| Febrero 2025 | Total Parados | Variacion | |||
| Mensual | Anual | ||||
| Absoluta | Relativa | Absoluta | Relativa | ||
| Total | 71 | -2 | -2.74 % | +9 | 14.52 % |
| HOMBRES | 31 | -2 | -6.06 % | +11 | 55.00 % |
| MUJERES | 38 | 0 | 0 % | 0 | 0 % |
| MENORES DE 25 AÑOS: | 8 | 0 | 0 % | -2 | -20.00 % |
| HOMBRES | 8 | 0 | 0 % | +3 | 60.00 % |
| MUJERES | <5 | - | 0 % | - | 0 % |
| ENTRE 25 Y 44 AÑOS | 22 | +1 | 4.76 % | +15 | 214.29 % |
| HOMBRES | 9 | +187 | 2,077.78 % | +9 | 100.00 % |
| MUJERES | 13 | +1 | 8.33 % | +6 | 85.71 % |
| MAYORES DE 45 AÑOS | 39 | -3 | -7.14 % | -2 | -4.88 % |
| HOMBRES | 14 | -2 | -12.50 % | -1 | -6.67 % |
| MUJERES | 25 | -1 | -3.85 % | -1 | -3.85 % |
| SECTOR: | |||||
| AGRICULTURA | <5 | - | 0 % | - | 0 % |
| INDUSTRIA | 13 | 0 | 0 % | +2 | 18.18 % |
| CONSTRUCCIÓN | 7 | +1 | 16.67 % | 0 | 0 % |
| SERVICIOS | 42 | -4 | -8.70 % | +7 | 20.00 % |
| SIN EMPLEO ANTERIOR | 8 | +1 | 14.29 % | +1 | 14.29 % |
| | | |
(Ir al Índice)
Los turistas de origen internacional ascendieron a 37 un -19,6% menos que en el mismo mes de 2023 y el nº de turistas nacionales fue de 85 un -19,0% menos.
El nº total de turistas que han visitado Llanera de Ranes de Enero a Diciembre de 2024 ha sido de 1.183 un 3,1% más que en el mismo periodo de 2023,el total de turistas de origen nacional ha sido de 781 (-15,6%) y los de origen internacional 402 (+81,1%).
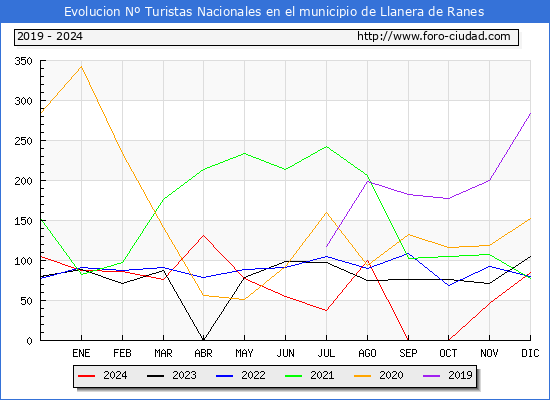
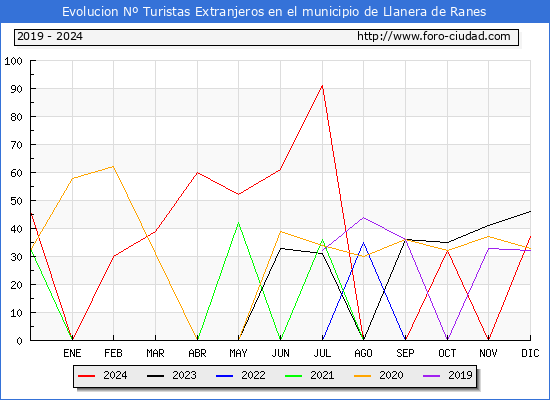
Estadisticas turísticas a Diciembre de 2024.
En Diciembre de 2024 el Nº de turistas que visitaron* Llanera de Ranes fue de 122 un -19,2% menos que en Diciembre de 2023.Los turistas de origen internacional ascendieron a 37 un -19,6% menos que en el mismo mes de 2023 y el nº de turistas nacionales fue de 85 un -19,0% menos.
El nº total de turistas que han visitado Llanera de Ranes de Enero a Diciembre de 2024 ha sido de 1.183 un 3,1% más que en el mismo periodo de 2023,el total de turistas de origen nacional ha sido de 781 (-15,6%) y los de origen internacional 402 (+81,1%).
| Estadísticas turísticas en otros municipios | |||
| Municipio | Total Turistas Diciembre 2024 | Diferencia Diciembre 2023 | Top |
| Valencia | 312.028 | +13.273 (4,4%) | 4 |
| Canals | 1.204 | -4 (-0,3%) | 2.107 |
| Xàtiva | 5.747 | -344 (-5,6%) | 514 |
*:Se consideran viajes turísticos todos los desplazamientos con destino principal fuera del lugar de residencia habitual de la persona, que implique una pernoctación fuera del mismo.
| | | |
(Ir al Índice)
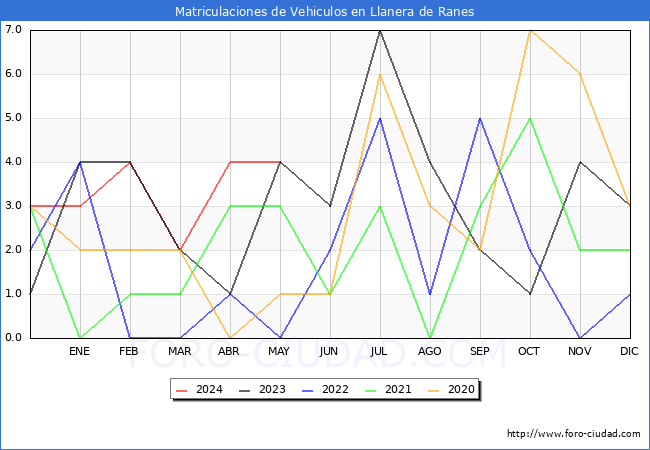
Matriculaciones vehículos en Mayo de 2024 .
| Matriculaciones | Mayo 2024 | Mayo 2023 | 12 Meses Interanual | 12 Meses Anteriores | ||||
| Mat | Dif | % | Mat | Dif | % | |||
| TOTAL | 4 | 4 | 0 | 0.00 % | 41 | 31 | +10 | 32.26 % |
| TURISMOS | 2 | 1 | +1 | 100.00 % | 21 | 16 | +5 | 31.25 % |
| CAMIONES | 1 | 0 | +1 | 100.00 % | 6 | 6 | 0 | 0.00 % |
| AUTOBUSES | 0 | 0 | 0 | 0.00 % | 0 | 0 | 0 | 0.00 % |
| CAMIONETAS | 0 | 0 | 0 | 0.00 % | 1 | 1 | 0 | 0.00 % |
| TRACTORES | 0 | 0 | 0 | 0.00 % | 0 | 0 | 0 | 0.00 % |
| MOTOCICLETAS | 0 | 2 | -2 | -100.00 % | 5 | 5 | 0 | 0.00 % |
| CICLOMOTORES | 1 | 1 | 0 | 0.00 % | 4 | 3 | +1 | 33.33 % |
| OTROS | 0 | 0 | 0 | 0.00 % | 4 | 0 | +4 | 100.00 % |
| Matriculaciones en otros municipios | ||
| Municipio | Matriculaciones Mayo 2024 | Diferencia Mayo 2023 |
| Valencia | 1.572 | -7 (-0.44%) |
| Canals | 17 | -10 (-37.04%) |
| Xàtiva | 63 | -29 (-31.52%) |
| Torrella | 0 | 0 (0.00%) |
| Cerdà | 0 | 0 (0.00%) |
| | | |
Elaboracion:Foro-ciudad.com (Se puede usar todo el contenido, insertando link a esta pagina).
Fuentes:
Instituto Nacional de Estadística
1900-1981: Poblaciones de hecho desde 1900 hasta 1991. Cifras oficiales sacadas de los Censos respectivos.
1986-1995: Poblaciones de derecho desde 1986 hasta 1995. Cifras de las rectificaciones y renovaciones Padrónales.
1996-2024: Cifras Oficiales de Población de los Municipios Españoles:Revisión del Padrón Municipal.
Medición del turismo a partir de la posición de los teléfonos móviles.
Ministerio de Hacienda y Administraciones Públicas
Agencia Tributaria
Servicio Público de Empleo Estatal
Seguridad Social
Ministerio de Fomento
DGT
Catastro *Datos no disponibles para Navarra y Pais Vasco.
Fuentes:
Instituto Nacional de Estadística
1900-1981: Poblaciones de hecho desde 1900 hasta 1991. Cifras oficiales sacadas de los Censos respectivos.
1986-1995: Poblaciones de derecho desde 1986 hasta 1995. Cifras de las rectificaciones y renovaciones Padrónales.
1996-2024: Cifras Oficiales de Población de los Municipios Españoles:Revisión del Padrón Municipal.
Medición del turismo a partir de la posición de los teléfonos móviles.
Ministerio de Hacienda y Administraciones Públicas
Agencia Tributaria
Servicio Público de Empleo Estatal
Seguridad Social
Ministerio de Fomento
DGT
Catastro *Datos no disponibles para Navarra y Pais Vasco.