Demografia de Riba-roja de Túria
Esta información pretende ofrecer una visión actual de la información demográfica puesta a disposición por el INE a través de sus diferentes publicaciones estadísticas, sobre todo usando como fuente el Padrón Municipal que se actualiza anualmente.
Mapa edad edificaciones
Evolución población 1900 hasta 2024
Habitantes segun lugar de nacimiento
Pirámide de población
Crecimiento Natural o Vegetativo
Numero de Matrimonios
Residentes en el Extranjero
Estadística del IRPF
Transacciones Inmobiliarias 3º Trimestre de 2024
Afiliados a la Seguridad Social a Agosto de 2025
Paro registrado a Agosto de 2025
Estadisticas Turismo a Diciembre de 2024
Matriculaciones vehículos en Mayo de 2024
Habitantes por Localidad
Habitantes en municipios cercanos
Habitantes provincia de Valencia 2024
(Ir al Índice)Evolución población 1900 hasta 2024
Habitantes segun lugar de nacimiento
Pirámide de población
Crecimiento Natural o Vegetativo
Numero de Matrimonios
Residentes en el Extranjero
Estadística del IRPF
Transacciones Inmobiliarias 3º Trimestre de 2024
Afiliados a la Seguridad Social a Agosto de 2025
Paro registrado a Agosto de 2025
Estadisticas Turismo a Diciembre de 2024
Matriculaciones vehículos en Mayo de 2024
Habitantes por Localidad
Habitantes en municipios cercanos
Habitantes provincia de Valencia 2024
Mapa edad edificaciones.
En el siguiente mapa se puede observar la edad de los edificios de Riba-roja de Túria, los datos provienen del Catastro y están actualizados a Octubre de 2019 .
Cada color representa una década, excepto el Negro que representa todos los edificios anteriores a 1900,que suele ser el casco histórico, en el mapa puede apreciarse como ha sido el desarrollo urbanístico de Riba-roja de Túria a lo largo del tiempo.
En la tabla posterior podemos ver la cantidad de superficie construida (en m2) por década,así como la posición que ocupa el municipio en un Top nacional y provincial para cada década.
En la tabla posterior podemos ver la cantidad de superficie construida (en m2) por década,así como la posición que ocupa el municipio en un Top nacional y provincial para cada década.
| Superficie Construida | ||||
| Decada | % Total | Top Provincial | Top Nacional* | |
| <1900 | 0.59% | <- 66º -> | <- 1237º -> | |
| 1900-1909 | 0.73% | <- 61º -> | <- 1930º -> | |
| 1910-1919 | 0.09% | <- 115º -> | <- 1796º -> | |
| 1920-1929 | 0.23% | <- 131º -> | <- 2150º -> | |
| 1930-1939 | 0.38% | <- 119º -> | <- 1447º -> | |
| 1940-1949 | 0.87% | <- 42º -> | <- 843º -> | |
| 1950-1959 | 1.33% | <- 41º -> | <- 674º -> | |
| 1960-1969 | 4.44% | <- 39º -> | <- 382º -> | |
| 1970-1979 | 9.55% | <- 34º -> | <- 352º -> | |
| 1980-1989 | 13.14% | <- 12º -> | <- 225º -> | |
| 1990-1999 | 17.78% | <- 8º -> | <- 195º -> | |
| 2000-2009 | 43.49% | <- 5º -> | <- 123º -> | |
| 2010-2019 | 7.38% | <- 6º -> | <- 122º -> | |
| Mapa edificaciones en otros Municipios |
(Ir al Índice)
Evolución de la población desde 1900 hasta 2024.
Segun los datos publicados por el INE a 1 de Enero de 2024 el número de habitantes en Riba-roja de Túria es de 24.230, 675 habitantes mas que el en el año 2023. En el grafico siguiente se puede ver cuantos habitantes tiene Riba-roja de Túria a lo largo de los años.| Habitantes en otros municipios | ||
| Municipio | Habitantes | Diferencia (2023) |
| Valencia | 825.948 | +18.255 |
| l'Eliana | 19.597 | +543 |
| Benaguasil | 12.336 | +459 |
| Vilamarxant | 11.041 | +269 |
| Loriguilla | 2.186 | +15 |
Actualmente la densidad de poblacion en Riba-roja de Túria es de 421,48 habitantes por Km2. Abajo se puede ver un mapa del casco urbano con las densidad de poblacion por secciones censales, en este caso se usa habitantes por 1.000m2. Se ha dividido por 1000 por lo que si se quiere pasar a Km2 solo hay que multiplicar su valor por 1000.

 |  |  |
Tabla con la evolución del número de hombres ,mujeres y total a lo largo de los años.
| Evolución de la población desde 1900 hasta 2024 | |||
| Año | Hombres | Mujeres | Total |
| 2024 | 12.247 | 11.983 | 24.230 |
| 2023 | 11.887 | 11.668 | 23.555 |
| 2022 | 11.643 | 11.407 | 23.050 |
| 2021 | 11.553 | 11.246 | 22.799 |
| 2020 | 11.541 | 11.220 | 22.761 |
| 2019 | 11.271 | 10.993 | 22.264 |
| 2018 | 11.157 | 10.835 | 21.992 |
| 2017 | 10.961 | 10.665 | 21.626 |
| 2016 | 10.926 | 10.595 | 21.521 |
| 2015 | 10.866 | 10.525 | 21.391 |
| 2014 | 10.940 | 10.559 | 21.499 |
| 2013 | 10.950 | 10.570 | 21.520 |
| 2012 | 10.872 | 10.477 | 21.349 |
| 2011 | 10.771 | 10.323 | 21.094 |
| 2010 | 10.568 | 10.187 | 20.755 |
| 2009 | 10.415 | 10.053 | 20.468 |
| 2008 | 10.132 | 9.806 | 19.938 |
| 2007 | 9.686 | 9.397 | 19.083 |
| 2006 | 9.305 | 9.024 | 18.329 |
| 2005 | 8.720 | 8.531 | 17.251 |
| 2004 | 8.241 | 8.021 | 16.262 |
| 2003 | 7.569 | 7.430 | 14.999 |
| 2002 | 7.160 | 7.101 | 14.261 |
| 2001 | 6.772 | 6.790 | 13.562 |
| 2000 | 6.452 | 6.456 | 12.908 |
| 1999 | 6.114 | 6.137 | 12.251 |
| 1998 | 5.801 | 5.870 | 11.671 |
| 1996 | 5.580 | 5.655 | 11.235 |
| 1995 | 5.563 | 5.568 | 11.131 |
| 1994 | 5.419 | 5.458 | 10.877 |
| 1993 | 5.218 | 5.257 | 10.475 |
| 1992 | 4.954 | 4.976 | 9.930 |
| 1991 | 4.866 | 4.912 | 9.778 |
| 1990 | 4.873 | 4.953 | 9.826 |
| 1989 | 4.813 | 4.880 | 9.693 |
| 1988 | 4.712 | 4.827 | 9.539 |
| 1987 | 4.665 | 4.783 | 9.448 |
| 1986 | 4.614 | 4.724 | 9.338 |
| 1981 | 0 | 0 | 8.035 |
| 1970 | 0 | 0 | 7.058 |
| 1960 | 0 | 0 | 5.781 |
| 1950 | 0 | 0 | 4.888 |
| 1940 | 0 | 0 | 4.764 |
| 1930 | 0 | 0 | 4.458 |
| 1920 | 0 | 0 | 4.372 |
| 1910 | 0 | 0 | 4.001 |
| 1900 | 0 | 0 | 3.624 |
(Ir al Índice)
Poblacion Máxima Estacional.
La población estacional máxima es una estimación de la población máxima que soporta Riba-roja de Túria. En el cálculo se incluyen las personas que tienen algún tipo de vinculación o relación con el municipio, ya sea porque residen, trabajan, estudian o pasan algún período de tiempo en él. Los datos son publicados anualmente por el Ministerio de Hacienda y Administraciones Públicas, en colaboración con las Diputaciones Provinciales, Cabildos y Consejos Insulares.| Poblacion Estacional Máxima | |||
| Año | Personas | ||
| 2016 | 28.391 | ||
| 2015 | 28.075 | ||
| 2014 | 28.052 | ||
| 2013 | 27.844 | ||
| 2012 | 27.448 | ||
| 2011 | 26.928 | ||
| 2010 | 26.185 | ||
| 2009 | 25.628 | ||
| 2008 | 21.214 | ||
| 2005 | 20.592 | ||
| 2000 | 16.591 | ||
(Ir al Índice)
Habitantes segun lugar de nacimiento.
Según los datos publicados por el INE procedentes del padrón municipal de 2022 el 28.72% (6.621) de los habitantes empadronados en el Municipio de Riba-roja de Túria han nacido en dicho municipio, el 59.70% han emigrado a Riba-roja de Túria desde diferentes lugares de España, el 44.36% (10.224) desde otros municipios de la provincia de Valencia, el 1.38% (317) desde otras provincias de la Comunidad Valenciana, el 13.97% (3.219) desde otras comunidades autónomas y el 11.58% (2.669) han emigrado a Riba-roja de Túria desde otros países.
 |  |  |
| Estructura en otros Municipios |
En el siguiente gráfico podemos ver la evolución de la estructura de la población en el municipio de Riba-roja de Túria si lo comparamos con 2021 vemos
- Aumentan (3) los habitantes nacidos en Riba-roja de Túria, pasando del 29.03% al 28.72%.
- Aumentan (147) los habitantes nacidos en la provincia de Valencia, pasando del 44.20% al 44.36%.
- Aumentan (6) los habitantes nacidos en la Comunidad Valenciana, pasando del 1.36% al 1.38%.
- Disminuyen (-24) los habitantes nacidos en el resto de España, pasando del 14.22% al 13.97%.
- Aumentan (119) los habitantes nacidos en otros países, pasando del 11.18% al 11.58%.
- Aumentan (1.751) los habitantes nacidos en Riba-roja de Túria, pasando del 43.34% al 28.72%.
- Aumentan (6.318) los habitantes nacidos en la provincia de Valencia, pasando del 34.76% al 44.36%.
- Aumentan (174) los habitantes nacidos en la la Comunidad Valenciana, pasando del 1.27% al 1.38%.
- Aumentan (1.181) los habitantes nacidos en el resto de España, pasando del 18.14% al 13.97%.
- Aumentan (2.390) los habitantes nacidos en otros países, pasando del 2.48% al 11.58%.
 |  |  |
Segun los datos ofrecidos por el INE en la estadistica del Padrón los habitantes empadronados en Riba-roja de Túria que han nacido en otros países ascienden a 2.669. 
- 1086 habitantes, 470 hombres y 616 mujeres nacidos en América.
- 424 habitantes, 259 hombres y 165 mujeres nacidos en África.
- 229 habitantes, 127 hombres y 102 mujeres nacidos en Asia.
- 4 mujeres nacidas en Oceanía.


 |  |  |
| Habitantes segun Pais de Nacimiento | |||
| Pais | 2022 | Dif (2021) | |
| Bulgaria | 42 | -7 | |
| Francia | 215 | 6 | |
| Italia | 47 | -5 | |
| Polonia | 12 | 0 | |
| Portugal | 10 | -1 | |
| Reino Unido | 50 | 9 | |
| Alemania | 71 | 7 | |
| Rumanía | 226 | -21 | |
| Ucrania | 27 | -6 | |
| Rusia | 44 | 4 | |
| Argelia | 51 | 11 | |
| Marruecos | 331 | 7 | |
| Nigeria | 5 | -1 | |
| Senegal | 3 | 2 | |
| Cuba | 40 | 5 | |
| República Dominicana | 9 | -2 | |
| Argentina | 182 | 25 | |
| Bolivia | 29 | -4 | |
| Brasil | 68 | 3 | |
| Colombia | 208 | 48 | |
| Chile | 33 | 8 | |
| Ecuador | 78 | 12 | |
| Paraguay | 15 | -2 | |
| Perú | 52 | -2 | |
| Uruguay | 121 | 0 | |
| Venezuela | 123 | 12 | |
| China | 116 | -11 | |
| Pakistán | 79 | -2 | |
| Otros | 382 | 24 | |

 |  |  |
Teniendo en cuenta la proporción de habitantes nacidos en otro pais sobre la población total del municipio, hemos realizado un ranking, en el que la 1ª posición esta ocupada por el municipio con una proporción mayor de habitantes nacidos en otro pais, aquí puede verse en que lugar esta el municipio de Riba-roja de Túria y sus municipios cercanos.
| Top Municipal % Habitantes nacidos en otro pais | |||
| Provincia | Municipio | Pos | % |
| Madrid | Los Molinos | 1.159 | 16,45 |
| Valencia | l'Eliana | 1.768 | 13,52 |
| Valencia | Benaguasil | 1.966 | 12,76 |
| Valencia | Vilamarxant | 2.184 | 11,97 |
| Valencia | la Pobla de Vallbona | 2.294 | 11,64 |
| Huesca | Lupiñén-Ortilla | 2.313 | 11,58 |
| Valencia | Riba-roja de Túria | 2.314 | 11,58 |
| Valladolid | Peñafiel | 2.315 | 11,58 |
| Valencia | Benisanó | 2.496 | 11,04 |
| Valencia | Loriguilla | 2.695 | 10,43 |
 |  |  |
| Pirámide en otros Municipios |
La media de edad de los habitantes de Riba-roja de Túria es de 41,29 años, 1,56 años mas que hace un lustro que era de 39,73 años.
En el siguiente mapa de Riba-roja de Túria se puede ver la edad media de los habitantes del municipio por secciones censales según los datos de 2019.

 |  |  |
| Población de Riba-roja de Túria por sexo y edad 2024 (grupos quinquenales) | |||
| Edad | Hombres | Mujeres | Total |
| 0-5 | 463 | 437 | 900 |
| 5-10 | 578 | 610 | 1.188 |
| 10-15 | 774 | 688 | 1.462 |
| 15-20 | 852 | 782 | 1.634 |
| 20-25 | 732 | 743 | 1.475 |
| 25-30 | 671 | 554 | 1.225 |
| 30-35 | 681 | 615 | 1.296 |
| 35-40 | 759 | 673 | 1.432 |
| 40-45 | 970 | 980 | 1.950 |
| 45-50 | 1.164 | 1.142 | 2.306 |
| 50-55 | 1.082 | 1.031 | 2.113 |
| 55-60 | 1.014 | 960 | 1.974 |
| 60-65 | 864 | 836 | 1.700 |
| 65-70 | 623 | 615 | 1.238 |
| 70-75 | 407 | 424 | 831 |
| 75-80 | 280 | 299 | 579 |
| 80-85 | 192 | 254 | 446 |
| 85- | 161 | 318 | 479 |
| Total | 12.269 | 11.966 | 24.235 |
La poblacion menor de 18 años en Riba-roja de Túria es de 4.528 (2.323 H, 2.205 M ), el 18,7%.
La poblacion entre 18 y 65 años en Riba-roja de Túria es de 16.442 (8.441 H, 8.001 M ), el 67,8%.
La poblacion mayor de 65 años en Riba-roja de Túria es de 3.265 (1.505 H, 1.760 M ), el 13,5%.
 |  |  |
(Ir al Índice)
Crecimiento Natural o Vegetativo.
El crecimiento natural de la población en el municipio de Riba-roja de Túria, según los últimos datos publicados por el INE para el año 2023 ha sido Positivo, con 5 nacimientos mas que defunciones.  |  |  |
Tabla con la evolución del número de nacimientos , defunciones y crecimiento vegetativo.
| Evolución Nacimientos y Defunciones desde 1996 hasta 2023 | |||
| Año | Nacimientos | Fallecidos | Diferencia |
| 2023 | 165 | 160 | 5 |
| 2022 | 173 | 165 | 8 |
| 2021 | 160 | 148 | 12 |
| 2020 | 154 | 145 | 9 |
| 2019 | 160 | 145 | 15 |
| 2018 | 180 | 124 | 56 |
| 2017 | 178 | 145 | 33 |
| 2016 | 185 | 142 | 43 |
| 2015 | 174 | 114 | 60 |
| 2014 | 187 | 115 | 72 |
| 2013 | 197 | 116 | 81 |
| 2012 | 231 | 116 | 115 |
| 2011 | 224 | 137 | 87 |
| 2010 | 277 | 100 | 177 |
| 2009 | 259 | 125 | 134 |
| 2008 | 279 | 97 | 182 |
| 2007 | 265 | 113 | 152 |
| 2006 | 255 | 104 | 151 |
| 2005 | 292 | 129 | 163 |
| 2004 | 227 | 136 | 91 |
| 2003 | 230 | 121 | 109 |
| 2002 | 178 | 106 | 72 |
| 2001 | 173 | 113 | 60 |
| 2000 | 177 | 97 | 80 |
| 1999 | 161 | 109 | 52 |
| 1998 | 111 | 111 | 0 |
| 1997 | 128 | 115 | 13 |
| 1996 | 133 | 103 | 30 |
(Ir al Índice)
Evolución número de Matrimonios.
En el siguiente grafico y tabla podemos ver la evolución en el número de matrimonios que se han otorgado en el Municipio de Riba-roja de Túria hasta el año 2023.
 |  |  |
| Evolución Matrimonios desde 1996 hasta 2023 | |
| Año | Matrimonios |
| 2023 | 107 |
| 2022 | 99 |
| 2021 | 103 |
| 2020 | 60 |
| 2019 | 97 |
| 2018 | 98 |
| 2017 | 84 |
| 2016 | 106 |
| 2015 | 98 |
| 2014 | 79 |
| 2013 | 80 |
| 2012 | 79 |
| 2011 | 92 |
| 2010 | 95 |
| 2009 | 88 |
| 2008 | 136 |
| 2007 | 122 |
| 2006 | 116 |
| 2005 | 119 |
| 2004 | 124 |
| 2003 | 123 |
| 2002 | 119 |
| 2001 | 88 |
| 2000 | 104 |
| 1999 | 106 |
| 1998 | 84 |
| 1997 | 68 |
| 1996 | 83 |
(Ir al Índice)
Residentes en el extranjero.
Segun los datos publicados por el INE en el CERA, Censo Electoral de españoles residentes en el extranjero a 1 de Noviembre de 2024 los los españoles que residen habitualmente en el extranjero o han trasladado al extranjero su residencia habitual mayores de 18 años eran 269 personas con municipio de origen en Riba-roja de Túria.
 |  |  |
(Ir al Índice)
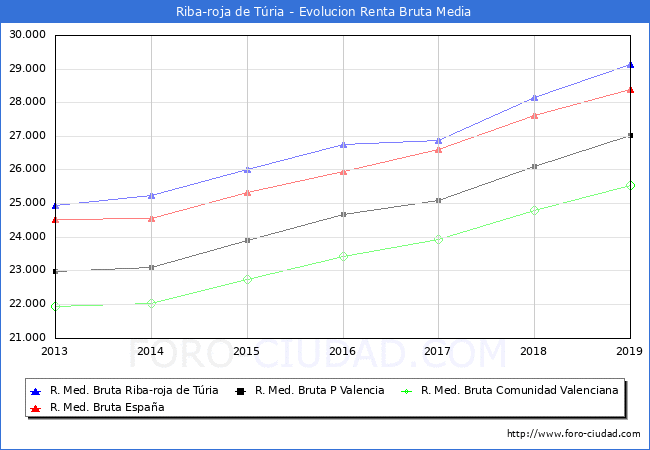
En 2019 Riba-roja de Túria se sitúa como el municipio nº13 con una mayor renta bruta media de la provincia de Valencia, y en la posición nº18 en la Comunidad Valenciana, el 511 a nivel Nacional (sin PV y Navarra), abajo se muestra una tabla con las posiciónes en las que se encuentran los municipios cercanos y con población parecida.
Los habitantes de Riba-roja de Túria liquidaron 47.034.378€ en concepto de IRPF en el año 2019 y recibieron por parte de las diferentes administraciones de forma directa en el presupuesto municipal (capitulo 4 Y 7) 9.296.468€ un 19,77% de lo aportado, en la siguiente tabla podemos ver las cifras de los municipios cercanos o de población similar.

Estadística del IRPF
Segun los datos hechos publicos por el Ministerio de Hacienda la renta bruta media por declarante, en el municipio de Riba-roja de Túria en 2019 fue de 29.137€, 991€ mas que en el año 2018 . Una vez descontada la liquidacion por IRPF y lo aportado a la Seguridad Social la renta disponible media por declarante se situó en 23.511€, 686€ mas que en el año 2018.  |  |  |
| Evolución de la Renta Media en Riba-roja de Túria | ||||
| Año | Renta Bruta | Var | Renta Dispo | Var |
| 2019 | 29.137€ | 991€ (3,40%) | 23.511€ | 686€ (2,92%) |
| 2018 | 28.146€ | 1.267€ (4,50%) | 22.825€ | 987€ (4,32%) |
| 2017 | 26.879€ | 108€ (0,40%) | 21.838€ | 20€ (0,09%) |
| 2016 | 26.771€ | 760€ (2,84%) | 21.818€ | 527€ (2,42%) |
| 2015 | 26.011€ | 761€ (2,93%) | 21.291€ | 850€ (3,99%) |
| 2014 | 25.250€ | 305€ (1,21%) | 20.441€ | 177€ (0,87%) |
| 2013 | 24.945€ | 0€ (0,00%) | 20.264€ | 0€ (0,00%) |
En 2019 Riba-roja de Túria se sitúa como el municipio nº13 con una mayor renta bruta media de la provincia de Valencia, y en la posición nº18 en la Comunidad Valenciana, el 511 a nivel Nacional (sin PV y Navarra), abajo se muestra una tabla con las posiciónes en las que se encuentran los municipios cercanos y con población parecida.
| Renta Municipios Cercanos | ||||
| Municipio | Renta Bruta | Pos Prov | Pos Comu | Pos Naci |
| l'Eliana (Valencia) | 37.356€ | 6 | 7 | 96 |
| Valencia (Valencia) | 31.655€ | 11 | 12 | 257 |
| Les Masies de Voltregà (Barcelona) | 29.150€ | 160 | 306 | 510 |
| Riba-roja de Túria (Valencia) | 29.137€ | 13 | 18 | 511 |
| La Llacuna (Barcelona) | 29.136€ | 161 | 307 | 512 |
| Loriguilla (Valencia) | 24.151€ | 55 | 87 | 1492 |
| Vilamarxant (Valencia) | 21.987€ | 112 | 187 | 2211 |
| Benaguasil (Valencia) | 21.406€ | 131 | 225 | 2432 |
Los habitantes de Riba-roja de Túria liquidaron 47.034.378€ en concepto de IRPF en el año 2019 y recibieron por parte de las diferentes administraciones de forma directa en el presupuesto municipal (capitulo 4 Y 7) 9.296.468€ un 19,77% de lo aportado, en la siguiente tabla podemos ver las cifras de los municipios cercanos o de población similar.
| Liquidación IPRF vs Presupuesto Ayuntamiento | |||
| Municipio | Liquidación | Capitulo 4 y 7 Presupuesto | % |
| l'Eliana (Valencia) | 59.580.627€ | 14.878.418€ | 24,97 % |
| Valencia (Valencia) | 2.054.470.877€ | 356.948.387€ | 17,37 % |
| Les Masies de Voltregà (Barcelona) | 6.876.648€ | 1.479.096€ | 21,51 % |
| Riba-roja de Túria (Valencia) | 47.034.378€ | 9.296.468€ | 19,77 % |
| La Llacuna (Barcelona) | 1.712.955€ | 730.509€ | 42,65 % |
| Loriguilla (Valencia) | 2.830.361€ | 1.664.205€ | 58,80 % |
| Vilamarxant (Valencia) | 10.565.293€ | 2.794.999€ | 26,45 % |
| Benaguasil (Valencia) | 11.836.957€ | 3.378.349€ | 28,54 % |
Indicadores de desigualdad.
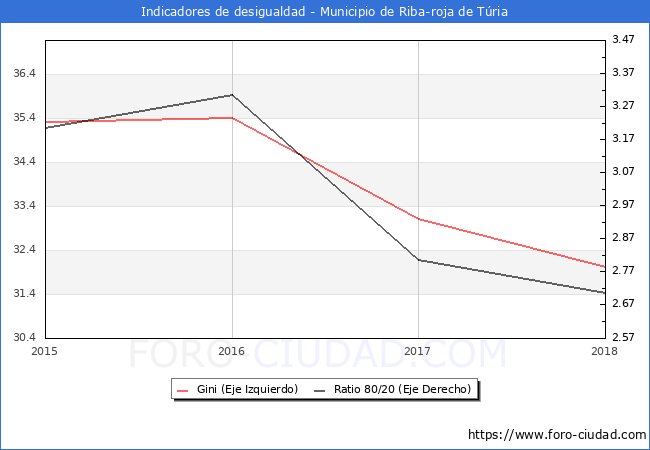
Íntimamente ligado a la pobreza se halla el concepto de desigualdad. Para entender mejor cómo afecta a la distribución de la renta en Riba-roja de Túria, mostramos los valores de dos de los indicadores habituales encargados de reflejarla, el ratio 80/20 y el Índice de Gini.
En el año 2018 el Indice de Gini para Riba-roja de Túria era de 32.00 y el ratio 80/20 era de 2.70.

Ratio 80/20 Cociente entre los ingresos totales del 20% de las personas con ingresos más elevados (percentil 80) y los ingresos totales del 20% de la población con menos ingresos (percentil 20).
El índice de Gini, es utilizado para analizar el grado de inequidad en la distribución respecto a los ingresos. Este indicador toma valores entre cero y uno (o entre 0 y 100 si se da en porcentaje); 0 cuando todas las personas tengan los mismos ingresos (perfecta igualdad), y 1 si todo el ingreso nacional está en manos de una única persona (perfecta desigualdad).
El índice de Gini, es utilizado para analizar el grado de inequidad en la distribución respecto a los ingresos. Este indicador toma valores entre cero y uno (o entre 0 y 100 si se da en porcentaje); 0 cuando todas las personas tengan los mismos ingresos (perfecta igualdad), y 1 si todo el ingreso nacional está en manos de una única persona (perfecta desigualdad).
| Indicadores en otros municipios | ||
| Municipio | Gini | Ratio 80/20 |
| Valencia | 35.40 | 3.20 |
| l'Eliana | 34.10 | 3.00 |
| Benaguasil | 30.70 | 2.50 |
| Vilamarxant | 29.50 | 2.60 |
| Loriguilla | 27.20 | 2.20 |
En el siguiente mapa de Riba-roja de Túria se puede ver la renta per capita de los habitantes del municipio por secciones censales con los datos del año 2018.

 |  |  |
| Precio de la vivienda en otros Municipios |
(Ir al Índice)
El nº total de Transacciones de vivienda hasta el 3º Trimestre de 2024 ha sido de 259 un 19.35% mas que en el mismo periodo de 2023 (217).
A continuación se muestra la evolución de los últimos años de forma grafica:
Transacciones Inmobiliarias 3ºT 2024
Segun los datos del 3º Trimestre del 2024 publicados por el Ministerio de Vivienda, el nº de transacciones inmobiliarias en el municipio de Riba-roja de Túria asciende a un total de 92, el 31.43% mas que en el 3T de 2023,de las cuales 2 son transacciones de viviendas nuevas y 90 de segunda mano.El nº total de Transacciones de vivienda hasta el 3º Trimestre de 2024 ha sido de 259 un 19.35% mas que en el mismo periodo de 2023 (217).
A continuación se muestra la evolución de los últimos años de forma grafica:

 |  |  |
(Ir al Índice)


Este grafico no es una imagen fiel de la población en edad de trabajar del municipio, debido a que la Seguridad Social, publica los Afiliados por municipio teniendo en cuenta el centro de trabajo y no la residencia del trabajador, por tanto en los municipios como capitales administrativas o municipios dormitorio los datos se alejaran de la realidad por el movimiento de trabajadores entre municipios.
Afiliados a la Seguridad Social a Agosto de 2025 .
| Agosto 2025 | Total Afiliados | Variacion | |||
| Mensual | Anual | ||||
| Absoluta | Relativa | Absoluta | Relativa | ||
| Total | 21694 | -146 | -0.67 % | +1173 | 5.72 % |
| REGIMEN: | |||||
| GENERAL | 19692 | -136 | -0.69 % | +1137 | 6.13 % |
| AUTONOMOS | 1834 | -5 | -0.27 % | +34 | 1.89 % |
| AGRARIO | 69 | -4 | -5.48 % | +2 | 2.99 % |
| HOGAR | 99 | -1 | -1.00 % | +1 | 1.02 % |
| MAR | 0 | 0 | 0 % | 0 | 0 % |
| CARBON | 0 | 0 | 0 % | 0 | 0 % |

| Afiliación en otros municipios | ||
| Municipio | Afiliados | Dif. Mes Ant. |
| Valencia | 465.451 | -2.796 |
| l'Eliana | 5.876 | -48 |
| Benaguasil | 2.531 | 21 |
| Vilamarxant | 2.259 | 12 |
| Loriguilla | 1.172 | -5 |

 |  |  |
(Ir al Índice)
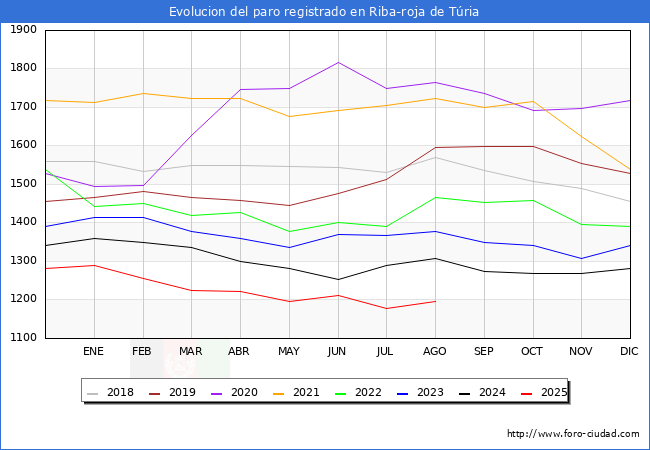
El número total de parados es de 1196, de los cuales 464 son hombres y 732 mujeres.
Las personas mayores de 45 años con 716 parados son el grupo de edad mas afectado por el paro, seguido de los que se encuentran entre 25 y 44 años con 395 parados, el grupo menos numeroso son los menores de 25 años con 85 parados.
Por sectores vemos que en el sector servicios es donde mayor número de parados existe en el municipio con 859 personas, seguido de la industria con 165 parados, la construcción con 99 parados, las personas sin empleo anterior con 63 parados y por ultimo la agricultura con 10 parados.
Paro registrado a Agosto de 2025.
Segun los datos publicados por el SEPE en el mes de Agosto el número de parados ha subido en 18 personas. De las 18 personas nuevas en de la lista del paro en Riba-roja de Túria aumento en 7 hombres y 11 mujeres.El número total de parados es de 1196, de los cuales 464 son hombres y 732 mujeres.
Las personas mayores de 45 años con 716 parados son el grupo de edad mas afectado por el paro, seguido de los que se encuentran entre 25 y 44 años con 395 parados, el grupo menos numeroso son los menores de 25 años con 85 parados.
Por sectores vemos que en el sector servicios es donde mayor número de parados existe en el municipio con 859 personas, seguido de la industria con 165 parados, la construcción con 99 parados, las personas sin empleo anterior con 63 parados y por ultimo la agricultura con 10 parados.
| Agosto 2025 | Total Parados | Variacion | |||
| Mensual | Anual | ||||
| Absoluta | Relativa | Absoluta | Relativa | ||
| Total | 1196 | +18 | 1.53 % | -111 | -8.49 % |
| HOMBRES | 464 | +7 | 1.53 % | -36 | -7.20 % |
| MUJERES | 732 | +11 | 1.53 % | -75 | -9.29 % |
| MENORES DE 25 AÑOS: | 85 | +5 | 6.25 % | -10 | -10.53 % |
| HOMBRES | 48 | -2 | -4.00 % | -1 | -2.04 % |
| MUJERES | 37 | +7 | 23.33 % | -9 | -19.57 % |
| ENTRE 25 Y 44 AÑOS | 395 | +13 | 3.40 % | -7 | -1.74 % |
| HOMBRES | 158 | +19538 | 12,687.01 % | 0 | 0 % |
| MUJERES | 237 | +9 | 3.95 % | -7 | -2.87 % |
| MAYORES DE 45 AÑOS | 716 | 0 | 0 % | -94 | -11.60 % |
| HOMBRES | 258 | +5 | 1.98 % | -35 | -11.95 % |
| MUJERES | 458 | -5 | -1.08 % | -59 | -11.41 % |
| SECTOR: | |||||
| AGRICULTURA | 10 | -1 | -9.09 % | -11 | -52.38 % |
| INDUSTRIA | 165 | +1 | 0.61 % | -9 | -5.17 % |
| CONSTRUCCIÓN | 99 | +6 | 6.45 % | -3 | -2.94 % |
| SERVICIOS | 859 | -4 | -0.46 % | -102 | -10.61 % |
| SIN EMPLEO ANTERIOR | 63 | +16 | 34.04 % | +14 | 28.57 % |

 |  |  |
(Ir al Índice)
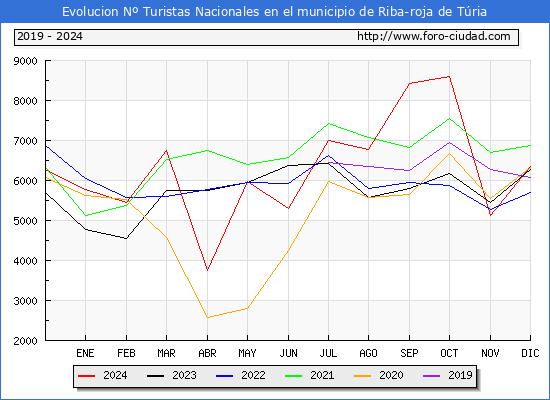
Los turistas de origen internacional ascendieron a 2.620 un 31,0% más que en el mismo mes de 2023 y el nº de turistas nacionales fue de 6.350 un 1,1% más.
El nº total de turistas que han visitado Riba-roja de Túria de Enero a Diciembre de 2024 ha sido de 104.437 un 14,8% más que en el mismo periodo de 2023,el total de turistas de origen nacional ha sido de 75.260 (+9,3%) y los de origen internacional 29.177 (+31,8%).

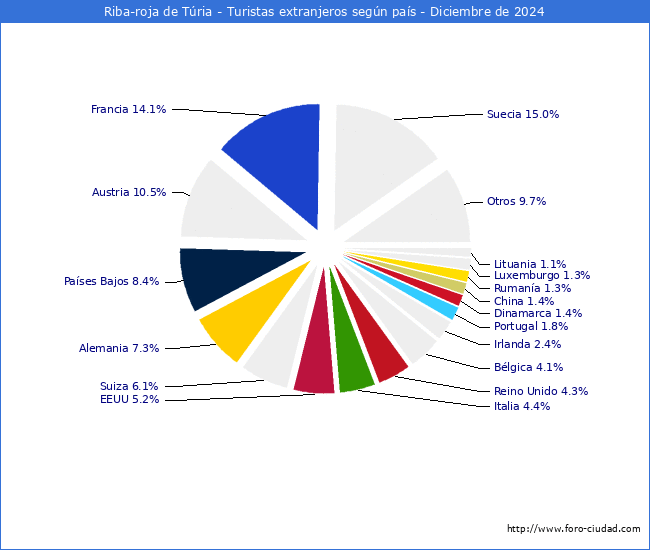
Estadisticas turísticas a Diciembre de 2024.
En Diciembre de 2024 el Nº de turistas que visitaron* Riba-roja de Túria fue de 8.970 un 8,3% más que en Diciembre de 2023.Los turistas de origen internacional ascendieron a 2.620 un 31,0% más que en el mismo mes de 2023 y el nº de turistas nacionales fue de 6.350 un 1,1% más.
El nº total de turistas que han visitado Riba-roja de Túria de Enero a Diciembre de 2024 ha sido de 104.437 un 14,8% más que en el mismo periodo de 2023,el total de turistas de origen nacional ha sido de 75.260 (+9,3%) y los de origen internacional 29.177 (+31,8%).


| Estadísticas turísticas en otros municipios | |||
| Municipio | Total Turistas Diciembre 2024 | Diferencia Diciembre 2023 | Top |
| Valencia | 312.028 | +13.273 (4,4%) | 4 |
| l'Eliana | 3.205 | +842 (35,6%) | 890 |
| Benaguasil | 1.465 | +98 (7,2%) | 1.814 |
| Vilamarxant | 1.883 | +569 (43,3%) | 1.476 |
| Loriguilla | 316 | +97 (44,3%) | 4.489 |
*:Se consideran viajes turísticos todos los desplazamientos con destino principal fuera del lugar de residencia habitual de la persona, que implique una pernoctación fuera del mismo.
 |  |  |
(Ir al Índice)
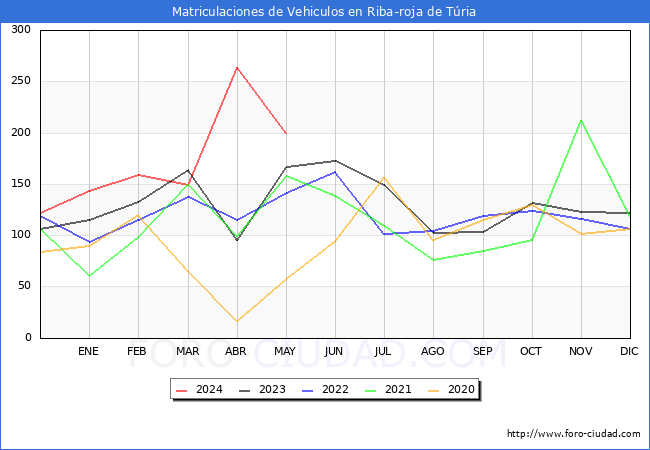
Matriculaciones vehículos en Mayo de 2024 .
| Matriculaciones | Mayo 2024 | Mayo 2023 | 12 Meses Interanual | 12 Meses Anteriores | ||||
| Mat | Dif | % | Mat | Dif | % | |||
| TOTAL | 200 | 166 | +34 | 20.48 % | 1815 | 1501 | +314 | 20.92 % |
| TURISMOS | 55 | 38 | +17 | 44.74 % | 518 | 452 | +66 | 14.60 % |
| CAMIONES | 76 | 68 | +8 | 11.76 % | 652 | 538 | +114 | 21.19 % |
| AUTOBUSES | 0 | 0 | 0 | 0.00 % | 0 | 0 | 0 | 0.00 % |
| CAMIONETAS | 17 | 16 | +1 | 6.25 % | 159 | 106 | +53 | 50.00 % |
| TRACTORES | 1 | 0 | +1 | 100.00 % | 5 | 2 | +3 | 150.00 % |
| MOTOCICLETAS | 13 | 13 | 0 | 0.00 % | 105 | 99 | +6 | 6.06 % |
| CICLOMOTORES | 1 | 1 | 0 | 0.00 % | 9 | 12 | -3 | -25.00 % |
| OTROS | 37 | 30 | +7 | 23.33 % | 367 | 292 | +75 | 25.68 % |
| Matriculaciones en otros municipios | ||
| Municipio | Matriculaciones Mayo 2024 | Diferencia Mayo 2023 |
| Valencia | 1.572 | -7 (-0.44%) |
| l'Eliana | 33 | -4 (-10.81%) |
| Benaguasil | 23 | +3 (15.00%) |
| Vilamarxant | 15 | +2 (15.38%) |
| Loriguilla | 6 | -2 (-25.00%) |

 |  |  |
(Ir al Índice)
Habitantes en localidades del Municipio.
- Clot de Navarrete (2000-2024)
- Els Pous (2000-2024)
- Entrenaranjos (2000-2024)
- Gallipont (2000-2024)
- Llobatera (2000-2024)
- Masía del Oliveral (2000-2024)
- Masía Traver (2000-2024)
- Monte Alcedo (2000-2024)
- Parque Monte Alcedo (2000-2024)
- Polígono Industrial Casanova (2000-2024)
- Polígono Industrial El Oliveral (2000-2024)
- Polígono Industrial Entrevías (2000-2024)
- Polígono Industrial Este (2000-2024)
- Polígono Industrial Sector 12 (2000-2024)
- Polígono Industrial Sector 13 (2000-2024)
- Polígono Industrial Sur (2000-2024)
- Residencial Reva (2000-2024)
- Santa Rosa (2000-2024)
- Urbanització el Molinet (2000-2024)
- Urbanització Santa Mónica (2000-2024)
- València la Vella (2000-2024)
- Ventas del Poyo (2000-2024)
Elaboracion:Foro-ciudad.com (Se puede usar todo el contenido, insertando link a esta pagina).
Fuentes:
Instituto Nacional de Estadística
1900-1981: Poblaciones de hecho desde 1900 hasta 1991. Cifras oficiales sacadas de los Censos respectivos.
1986-1995: Poblaciones de derecho desde 1986 hasta 1995. Cifras de las rectificaciones y renovaciones Padrónales.
1996-2024: Cifras Oficiales de Población de los Municipios Españoles:Revisión del Padrón Municipal.
Medición del turismo a partir de la posición de los teléfonos móviles.
Ministerio de Hacienda y Administraciones Públicas
Agencia Tributaria
Servicio Público de Empleo Estatal
Seguridad Social
Ministerio de Fomento
DGT
Catastro *Datos no disponibles para Navarra y Pais Vasco.


