Demografia de Montarrón
Esta información pretende ofrecer una visión actual de la información demográfica puesta a disposición por el INE a través de sus diferentes publicaciones estadísticas, sobre todo usando como fuente el Padrón Municipal que se actualiza anualmente.
Mapa edad edificaciones
Evolución población 1900 hasta 2024
Habitantes segun lugar de nacimiento
Pirámide de población
Crecimiento Natural o Vegetativo
Numero de Matrimonios
Residentes en el Extranjero
Transacciones Inmobiliarias 3º Trimestre de 2024
Afiliados a la Seguridad Social a Febrero de 2025
Paro registrado a Febrero de 2025
Estadisticas Turismo a Diciembre de 2024
Matriculaciones vehículos en Mayo de 2024
Habitantes en municipios cercanos
Habitantes provincia de Guadalajara 2024
(Ir al Índice)Evolución población 1900 hasta 2024
Habitantes segun lugar de nacimiento
Pirámide de población
Crecimiento Natural o Vegetativo
Numero de Matrimonios
Residentes en el Extranjero
Transacciones Inmobiliarias 3º Trimestre de 2024
Afiliados a la Seguridad Social a Febrero de 2025
Paro registrado a Febrero de 2025
Estadisticas Turismo a Diciembre de 2024
Matriculaciones vehículos en Mayo de 2024
Habitantes en municipios cercanos
Habitantes provincia de Guadalajara 2024
Mapa edad edificaciones.
En el siguiente mapa se puede observar la edad de los edificios de Montarrón, los datos provienen del Catastro y están actualizados a Octubre de 2019 .
Cada color representa una década, excepto el Negro que representa todos los edificios anteriores a 1900,que suele ser el casco histórico, en el mapa puede apreciarse como ha sido el desarrollo urbanístico de Montarrón a lo largo del tiempo.
En la tabla posterior podemos ver la cantidad de superficie construida (en m2) por década,así como la posición que ocupa el municipio en un Top nacional y provincial para cada década.
En la tabla posterior podemos ver la cantidad de superficie construida (en m2) por década,así como la posición que ocupa el municipio en un Top nacional y provincial para cada década.
| Superficie Construida | ||||
| Decada | % Total | Top Provincial | Top Nacional* | |
| <1900 | 0.00% | <- 236º -> | <- 6395º -> | |
| 1900-1909 | 5.62% | <- 265º -> | <- 6457º -> | |
| 1910-1919 | 1.64% | <- 129º -> | <- 4557º -> | |
| 1920-1929 | 1.01% | <- 207º -> | <- 6521º -> | |
| 1930-1939 | 0.00% | <- 260º -> | <- 7080º -> | |
| 1940-1949 | 50.70% | <- 32º -> | <- 3014º -> | |
| 1950-1959 | 1.46% | <- 223º -> | <- 6987º -> | |
| 1960-1969 | 0.23% | <- 262º -> | <- 7333º -> | |
| 1970-1979 | 11.95% | <- 167º -> | <- 6220º -> | |
| 1980-1989 | 17.71% | <- 184º -> | <- 6207º -> | |
| 1990-1999 | 8.77% | <- 188º -> | <- 6371º -> | |
| 2000-2009 | 0.92% | <- 287º -> | <- 7523º -> | |
| 2010-2019 | 0.00% | <- 287º -> | <- 7426º -> | |
| Mapa edificaciones en otros Municipios |
(Ir al Índice)
Evolución de la población desde 1900 hasta 2024.
Segun los datos publicados por el INE a 1 de Enero de 2024 el número de habitantes en Montarrón es de 32, 2 habitantes mas que el en el año 2023. En el grafico siguiente se puede ver cuantos habitantes tiene Montarrón a lo largo de los años.| Habitantes en otros municipios | ||
| Municipio | Habitantes | Diferencia (2023) |
| Guadalajara | 90.909 | +1.899 |
| Marchamalo | 8.497 | +224 |
| Cabanillas del Campo | 11.329 | +295 |
| Fuencemillán | 85 | +1 |
| Espinosa de Henares | 690 | +27 |
Actualmente la densidad de poblacion en Montarrón es de 2,87 habitantes por Km2.
Tabla con la evolución del número de hombres ,mujeres y total a lo largo de los años.
| Evolución de la población desde 1900 hasta 2024 | |||
| Año | Hombres | Mujeres | Total |
| 2024 | 20 | 12 | 32 |
| 2023 | 19 | 11 | 30 |
| 2022 | 17 | 9 | 26 |
| 2021 | 18 | 10 | 28 |
| 2020 | 15 | 10 | 25 |
| 2019 | 14 | 9 | 23 |
| 2018 | 15 | 11 | 26 |
| 2017 | 14 | 11 | 25 |
| 2016 | 14 | 12 | 26 |
| 2015 | 15 | 13 | 28 |
| 2014 | 16 | 14 | 30 |
| 2013 | 17 | 12 | 29 |
| 2012 | 19 | 12 | 31 |
| 2011 | 20 | 16 | 36 |
| 2010 | 21 | 16 | 37 |
| 2009 | 22 | 16 | 38 |
| 2008 | 24 | 16 | 40 |
| 2007 | 24 | 17 | 41 |
| 2006 | 24 | 22 | 46 |
| 2005 | 25 | 21 | 46 |
| 2004 | 24 | 20 | 44 |
| 2003 | 26 | 22 | 48 |
| 2002 | 31 | 24 | 55 |
| 2001 | 32 | 26 | 58 |
| 2000 | 33 | 25 | 58 |
| 1999 | 33 | 26 | 59 |
| 1998 | 33 | 26 | 59 |
| 1996 | 37 | 27 | 64 |
| 1995 | 44 | 31 | 75 |
| 1994 | 44 | 31 | 75 |
| 1993 | 44 | 33 | 77 |
| 1992 | 41 | 32 | 73 |
| 1991 | 41 | 32 | 73 |
| 1990 | 50 | 42 | 92 |
| 1989 | 49 | 40 | 89 |
| 1988 | 49 | 41 | 90 |
| 1987 | 49 | 41 | 90 |
| 1986 | 48 | 42 | 90 |
| 1981 | 0 | 0 | 86 |
| 1970 | 0 | 0 | 120 |
| 1960 | 0 | 0 | 165 |
| 1950 | 0 | 0 | 236 |
| 1940 | 0 | 0 | 131 |
| 1930 | 0 | 0 | 377 |
| 1920 | 0 | 0 | 503 |
| 1910 | 0 | 0 | 547 |
| 1900 | 0 | 0 | 469 |
(Ir al Índice)
Poblacion Máxima Estacional.
La población estacional máxima es una estimación de la población máxima que soporta Montarrón. En el cálculo se incluyen las personas que tienen algún tipo de vinculación o relación con el municipio, ya sea porque residen, trabajan, estudian o pasan algún período de tiempo en él. Los datos son publicados anualmente por el Ministerio de Hacienda y Administraciones Públicas, en colaboración con las Diputaciones Provinciales, Cabildos y Consejos Insulares.| Poblacion Estacional Máxima | |||
| Año | Personas | ||
| 2016 | 150 | ||
| 2015 | 150 | ||
| 2013 | 150 | ||
| 2011 | 150 | ||
| 2010 | 150 | ||
| 2009 | 150 | ||
| 2008 | 150 | ||
| 2005 | 150 | ||
| 2000 | 100 | ||
(Ir al Índice)
Habitantes segun lugar de nacimiento.
Según los datos publicados por el INE procedentes del padrón municipal de 2022 el 23.08% (6) de los habitantes empadronados en el Municipio de Montarrón han nacido en dicho municipio, el 73.08% han emigrado a Montarrón desde diferentes lugares de España, el 30.77% (8) desde otros municipios de la provincia de Guadalajara, el 42.31% (11) desde otras comunidades autónomas y el 3.85% (1) han emigrado a Montarrón desde otros países.
 |  |  |
| Estructura en otros Municipios |
En el siguiente gráfico podemos ver la evolución de la estructura de la población en el municipio de Montarrón si lo comparamos con 2021 vemos
- Se mantienen en igual numero los habitantes nacidos en Montarrón, pasando del 21.43% al 23.08%.
- Disminuyen (-1) los habitantes nacidos en la provincia de Guadalajara, pasando del 32.14% al 30.77%.
- Disminuyen (-1) los habitantes nacidos en el resto de España, pasando del 42.86% al 42.31%.
- Se mantienen en igual numero los habitantes nacidos en otros países, pasando del 3.57% al 3.85%.
- Disminuyen (-23) los habitantes nacidos en Montarrón, pasando del 45.31% al 23.08%.
- Disminuyen (-12) los habitantes nacidos en la provincia de Guadalajara, pasando del 31.25% al 30.77%.
- Disminuyen (-2) los habitantes nacidos en la la comunidad de Castilla-La Mancha, pasando del 3.13% al 0.00%.
- Aumentan (1) los habitantes nacidos en el resto de España, pasando del 15.63% al 42.31%.
- Disminuyen (-2) los habitantes nacidos en otros países, pasando del 4.69% al 3.85%.
 |  |  |
Segun los datos ofrecidos por el INE en la estadistica del Padrón los habitantes empadronados en Montarrón que han nacido en otros países ascienden a 1.
- 1 mujer nacida en Asia.

 |  |  |

 |  |  |
Teniendo en cuenta la proporción de habitantes nacidos en otro pais sobre la población total del municipio, hemos realizado un ranking, en el que la 1ª posición esta ocupada por el municipio con una proporción mayor de habitantes nacidos en otro pais, aquí puede verse en que lugar esta el municipio de Montarrón y sus municipios cercanos.
| Top Municipal % Habitantes nacidos en otro pais | |||
| Provincia | Municipio | Pos | % |
| Guadalajara | Alarilla | 221 | 28,68 |
| Guadalajara | Espinosa de Henares | 1.033 | 17,12 |
| Guadalajara | Cogolludo | 1.423 | 15,10 |
| Segovia | Navalmanzano | 2.986 | 9,68 |
| Guadalajara | Arbancón | 4.175 | 6,90 |
| Zaragoza | Lobera de Onsella | 5.967 | 3,85 |
| Guadalajara | Montarrón | 5.968 | 3,85 |
| Burgos | La Sequera de Haza | 5.969 | 3,85 |
| Guadalajara | Fuencemillán | 7.494 | 1,27 |
| Guadalajara | Monasterio | 7.950 | 0,00 |
 |  |  |
| Pirámide en otros Municipios |
La media de edad de los habitantes de Montarrón es de 60,35 años, 0,59 años mas que hace un lustro que era de 59,76 años.
| Población de Montarrón por sexo y edad 2022 (grupos quinquenales) | |||
| Edad | Hombres | Mujeres | Total |
| 0-5 | 0 | 0 | 0 |
| 5-10 | 0 | 0 | 0 |
| 10-15 | 0 | 0 | 0 |
| 15-20 | 0 | 0 | 0 |
| 20-25 | 0 | 0 | 0 |
| 25-30 | 0 | 1 | 1 |
| 30-35 | 0 | 1 | 1 |
| 35-40 | 2 | 0 | 2 |
| 40-45 | 0 | 0 | 0 |
| 45-50 | 0 | 1 | 1 |
| 50-55 | 3 | 0 | 3 |
| 55-60 | 3 | 2 | 5 |
| 60-65 | 1 | 0 | 1 |
| 65-70 | 3 | 2 | 5 |
| 70-75 | 1 | 1 | 2 |
| 75-80 | 2 | 0 | 2 |
| 80-85 | 1 | 1 | 2 |
| 85- | 1 | 0 | 1 |
| Total | 17 | 9 | 26 |
La poblacion menor de 18 años en Montarrón es de 0 (0 H, 0 M ), el 0,0%.
La poblacion entre 18 y 65 años en Montarrón es de 17 (11 H, 6 M ), el 65,4%.
La poblacion mayor de 65 años en Montarrón es de 9 (6 H, 3 M ), el 34,6%.
 |  |  |
(Ir al Índice)
Crecimiento Natural o Vegetativo.
El crecimiento natural de la población en el municipio de Montarrón, según los últimos datos publicados por el INE para el año 2022 ha sido Negativo, con 1 defunciones mas que nacimientos.  |  |  |
Tabla con la evolución del número de nacimientos , defunciones y crecimiento vegetativo.
| Evolución Nacimientos y Defunciones desde 1996 hasta 2022 | |||
| Año | Nacimientos | Fallecidos | Diferencia |
| 2022 | 0 | 1 | -1 |
| 2021 | 0 | 1 | -1 |
| 2020 | 0 | 1 | -1 |
| 2019 | 0 | 1 | -1 |
| 2018 | 0 | 2 | -2 |
| 2017 | 0 | 1 | -1 |
| 2016 | 0 | 0 | 0 |
| 2015 | 0 | 0 | 0 |
| 2014 | 0 | 2 | -2 |
| 2013 | 0 | 1 | -1 |
| 2012 | 0 | 2 | -2 |
| 2011 | 0 | 1 | -1 |
| 2010 | 1 | 2 | -1 |
| 2009 | 0 | 0 | 0 |
| 2008 | 0 | 1 | -1 |
| 2007 | 0 | 0 | 0 |
| 2006 | 0 | 0 | 0 |
| 2005 | 0 | 1 | -1 |
| 2004 | 0 | 0 | 0 |
| 2003 | 0 | 0 | 0 |
| 2002 | 0 | 2 | -2 |
| 2001 | 0 | 1 | -1 |
| 2000 | 0 | 1 | -1 |
| 1999 | 0 | 1 | -1 |
| 1998 | 0 | 0 | 0 |
| 1997 | 0 | 2 | -2 |
| 1996 | 0 | 1 | -1 |
(Ir al Índice)
Evolución número de Matrimonios.
En el siguiente grafico y tabla podemos ver la evolución en el número de matrimonios que se han otorgado en el Municipio de Montarrón hasta el año 2022.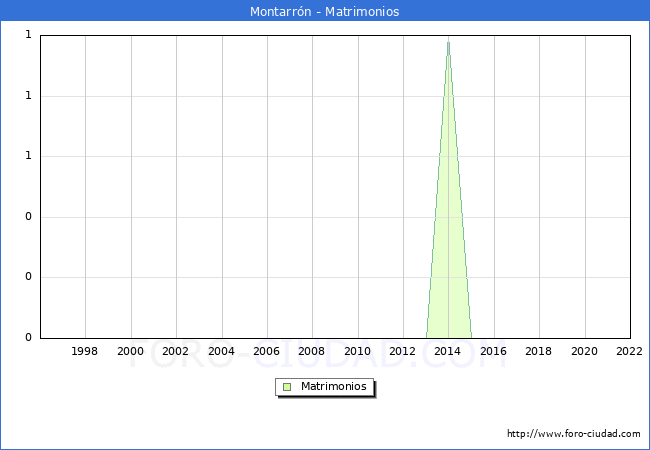
 |  |  |
| Evolución Matrimonios desde 1996 hasta 2022 | |
| Año | Matrimonios |
| 2022 | 0 |
| 2021 | 0 |
| 2020 | 0 |
| 2019 | 0 |
| 2018 | 0 |
| 2017 | 0 |
| 2016 | 0 |
| 2015 | 0 |
| 2014 | 1 |
| 2013 | 0 |
| 2012 | 0 |
| 2011 | 0 |
| 2010 | 0 |
| 2009 | 0 |
| 2008 | 0 |
| 2007 | 0 |
| 2006 | 0 |
| 2005 | 0 |
| 2004 | 0 |
| 2003 | 0 |
| 2002 | 0 |
| 2001 | 0 |
| 2000 | 0 |
| 1999 | 0 |
| 1998 | 0 |
| 1997 | 0 |
| 1996 | 0 |
(Ir al Índice)
Residentes en el extranjero.
Segun los datos publicados por el INE en el CERA, Censo Electoral de españoles residentes en el extranjero a 1 de Noviembre de 2024 los los españoles que residen habitualmente en el extranjero o han trasladado al extranjero su residencia habitual mayores de 18 años eran 3 personas con municipio de origen en Montarrón.
 |  |  |
| Precio de la vivienda en otros Municipios |
(Ir al Índice)
El nº total de Transacciones de vivienda hasta el 3º Trimestre de 2024 ha sido de 1 un 0.00% igual que en el mismo periodo de 2023 (1).
A continuación se muestra la evolución de los últimos años de forma grafica:
Transacciones Inmobiliarias 3ºT 2024
Segun los datos del 3º Trimestre del 2024 publicados por el Ministerio de Vivienda, el nº de transacciones inmobiliarias en el municipio de Montarrón asciende a un total de 0, igual que en el 3T de 2023,de las cuales 0 son transacciones de viviendas nuevas y 0 de segunda mano.El nº total de Transacciones de vivienda hasta el 3º Trimestre de 2024 ha sido de 1 un 0.00% igual que en el mismo periodo de 2023 (1).
A continuación se muestra la evolución de los últimos años de forma grafica:

 |  |  |
(Ir al Índice)


Este grafico no es una imagen fiel de la población en edad de trabajar del municipio, debido a que la Seguridad Social, publica los Afiliados por municipio teniendo en cuenta el centro de trabajo y no la residencia del trabajador, por tanto en los municipios como capitales administrativas o municipios dormitorio los datos se alejaran de la realidad por el movimiento de trabajadores entre municipios.
Afiliados a la Seguridad Social a Febrero de 2025 .
| Febrero 2025 | Total Afiliados | Variacion | |||
| Mensual | Anual | ||||
| Absoluta | Relativa | Absoluta | Relativa | ||
| Total | 2 | 0 | 0 % | 0 | 0 % |
| REGIMEN: | |||||
| GENERAL | <5 | - | 0 % | - | 0 % |
| AUTONOMOS | <5 | - | 0 % | - | 0 % |
| AGRARIO | 0 | 0 | 0 % | 0 | 0 % |
| HOGAR | 0 | 0 | 0 % | 0 | 0 % |
| MAR | 0 | 0 | 0 % | 0 | 0 % |
| CARBON | 0 | 0 | 0 % | 0 | 0 % |

| Afiliación en otros municipios | ||
| Municipio | Afiliados | Dif. Mes Ant. |
| Guadalajara | 42.337 | -461 |
| Marchamalo | 5.973 | -137 |
| Cabanillas del Campo | 10.876 | -294 |
| Fuencemillán | 8 | 0 |
| Espinosa de Henares | 127 | 6 |

 |  |  |
(Ir al Índice)
El número total de parados es de 0, de los cuales 0 son hombres y 0 mujeres.
Las personas mayores de 45 años con 0 parados son el grupo de edad mas afectado por el paro, seguido de los que se encuentran entre 25 y 44 años con 0 parados, el grupo menos numeroso son los menores de 25 años con 0 parados.
Por sectores vemos que en el sector servicios es donde mayor número de parados existe en el municipio con <5 personas, seguido de la agricultura con 0 parados, las personas sin empleo anterior con parados, la construcción con parados y por ultimo la industria con parados.
Paro registrado a Febrero de 2025.
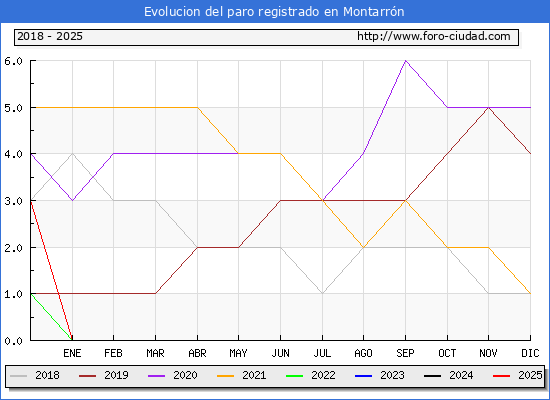
Segun los datos publicados por el SEPE en el mes de Febrero el número de parados no ha variado.El número total de parados es de 0, de los cuales 0 son hombres y 0 mujeres.
Las personas mayores de 45 años con 0 parados son el grupo de edad mas afectado por el paro, seguido de los que se encuentran entre 25 y 44 años con 0 parados, el grupo menos numeroso son los menores de 25 años con 0 parados.
Por sectores vemos que en el sector servicios es donde mayor número de parados existe en el municipio con <5 personas, seguido de la agricultura con 0 parados, las personas sin empleo anterior con parados, la construcción con parados y por ultimo la industria con parados.
| Febrero 2025 | Total Parados | Variacion | |||
| Mensual | Anual | ||||
| Absoluta | Relativa | Absoluta | Relativa | ||
| Total | 0 | 0 | 0 % | 0 | 0 % |
| HOMBRES | 0 | - | 0 % | - | 0 % |
| MUJERES | 0 | - | 0 % | - | 0 % |
| MENORES DE 25 AÑOS: | 0 | - | 0 % | - | 0 % |
| HOMBRES | 0 | 0 % | 0 | 0 % | |
| MUJERES | 0 | 0 % | 0 | 0 % | |
| ENTRE 25 Y 44 AÑOS | 0 | - | 0 % | - | 0 % |
| HOMBRES | - | 0 % | 0 | 0 % | |
| MUJERES | 0 | 0 % | 0 | 0 % | |
| MAYORES DE 45 AÑOS | 0 | - | 0 % | - | 0 % |
| HOMBRES | <5 | - | 0 % | - | 0 % |
| MUJERES | 0 | 0 % | 0 | 0 % | |
| SECTOR: | |||||
| AGRICULTURA | 0 | 0 | 0 % | 0 | 0 % |
| INDUSTRIA | 0 | 0 % | 0 | 0 % | |
| CONSTRUCCIÓN | 0 | 0 % | 0 | 0 % | |
| SERVICIOS | <5 | - | 0 % | - | 0 % |
| SIN EMPLEO ANTERIOR | 0 | 0 % | 0 | 0 % | |

 |  |  |
(Ir al Índice)
Los turistas de origen internacional ascendieron a 0 un -100,0% menos que en el mismo mes de 2023 y el nº de turistas nacionales fue de 91 un 102,2% más.
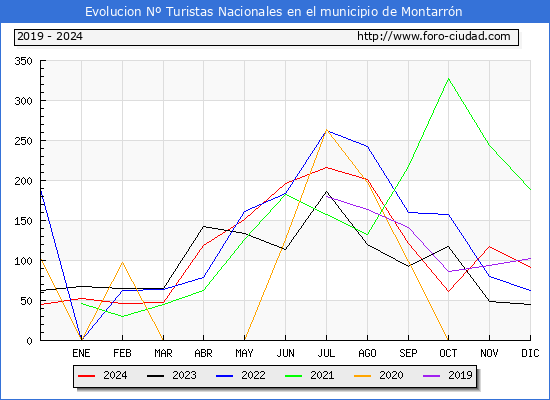
El nº total de turistas que han visitado Montarrón de Enero a Diciembre de 2024 ha sido de 1.569 un 11,3% más que en el mismo periodo de 2023,el total de turistas de origen nacional ha sido de 1.420 (+18,5%) y los de origen internacional 149 (-29,7%).

Estadisticas turísticas a Diciembre de 2024.
En Diciembre de 2024 el Nº de turistas que visitaron* Montarrón fue de 91 un 9,6% más que en Diciembre de 2023.Los turistas de origen internacional ascendieron a 0 un -100,0% menos que en el mismo mes de 2023 y el nº de turistas nacionales fue de 91 un 102,2% más.
El nº total de turistas que han visitado Montarrón de Enero a Diciembre de 2024 ha sido de 1.569 un 11,3% más que en el mismo periodo de 2023,el total de turistas de origen nacional ha sido de 1.420 (+18,5%) y los de origen internacional 149 (-29,7%).


| Estadísticas turísticas en otros municipios | |||
| Municipio | Total Turistas Diciembre 2024 | Diferencia Diciembre 2023 | Top |
| Guadalajara | 36.739 | +2.466 (7,2%) | 79 |
| Marchamalo | 2.944 | +665 (29,2%) | 965 |
| Cabanillas del Campo | 7.830 | +1.266 (19,3%) | 375 |
| Fuencemillán | 89 | +10 (12,7%) | 6.090 |
| Espinosa de Henares | 931 | -105 (-10,1%) | 2.548 |
*:Se consideran viajes turísticos todos los desplazamientos con destino principal fuera del lugar de residencia habitual de la persona, que implique una pernoctación fuera del mismo.
 |  |  |
(Ir al Índice)
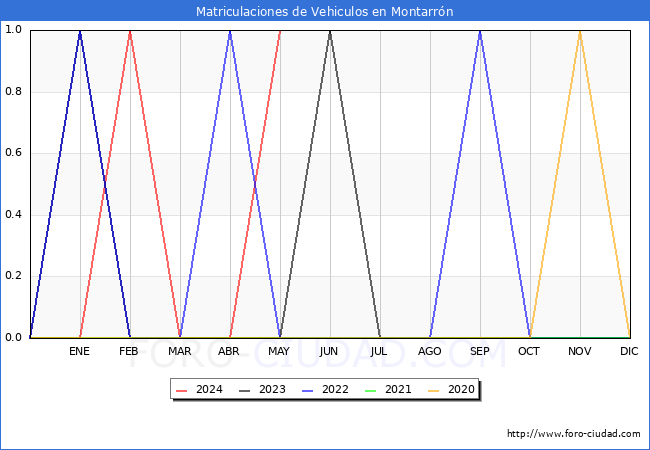
Matriculaciones vehículos en Mayo de 2024 .
| Matriculaciones | Mayo 2024 | Mayo 2023 | 12 Meses Interanual | 12 Meses Anteriores | ||||
| Mat | Dif | % | Mat | Dif | % | |||
| TOTAL | 1 | 0 | +1 | 100.00 % | 3 | 2 | +1 | 50.00 % |
| TURISMOS | 1 | 0 | +1 | 100.00 % | 3 | 1 | +2 | 200.00 % |
| CAMIONES | 0 | 0 | 0 | 0.00 % | 0 | 0 | 0 | 0.00 % |
| AUTOBUSES | 0 | 0 | 0 | 0.00 % | 0 | 0 | 0 | 0.00 % |
| CAMIONETAS | 0 | 0 | 0 | 0.00 % | 0 | 0 | 0 | 0.00 % |
| TRACTORES | 0 | 0 | 0 | 0.00 % | 0 | 1 | -1 | -100.00 % |
| MOTOCICLETAS | 0 | 0 | 0 | 0.00 % | 0 | 0 | 0 | 0.00 % |
| CICLOMOTORES | 0 | 0 | 0 | 0.00 % | 0 | 0 | 0 | 0.00 % |
| OTROS | 0 | 0 | 0 | 0.00 % | 0 | 0 | 0 | 0.00 % |
| Matriculaciones en otros municipios | ||
| Municipio | Matriculaciones Mayo 2024 | Diferencia Mayo 2023 |
| Guadalajara | 192 | +35 (22.29%) |
| Marchamalo | 16 | +1 (6.67%) |
| Cabanillas del Campo | 30 | +3 (11.11%) |
| Fuencemillán | 0 | 0 (0.00%) |
| Espinosa de Henares | 2 | +2 (100.00%) |

 |  |  |
Elaboracion:Foro-ciudad.com (Se puede usar todo el contenido, insertando link a esta pagina).
Fuentes:
Instituto Nacional de Estadística
1900-1981: Poblaciones de hecho desde 1900 hasta 1991. Cifras oficiales sacadas de los Censos respectivos.
1986-1995: Poblaciones de derecho desde 1986 hasta 1995. Cifras de las rectificaciones y renovaciones Padrónales.
1996-2024: Cifras Oficiales de Población de los Municipios Españoles:Revisión del Padrón Municipal.
Medición del turismo a partir de la posición de los teléfonos móviles.
Ministerio de Hacienda y Administraciones Públicas
Agencia Tributaria
Servicio Público de Empleo Estatal
Seguridad Social
Ministerio de Fomento
DGT
Catastro *Datos no disponibles para Navarra y Pais Vasco.


