Demografia de Cangas del Narcea
Esta información pretende ofrecer una visión actual de la información demográfica puesta a disposición por el INE a través de sus diferentes publicaciones estadísticas, sobre todo usando como fuente el Padrón Municipal que se actualiza anualmente.
Mapa edad edificaciones
Evolución población 1900 hasta 2024
Habitantes segun lugar de nacimiento
Pirámide de población
Crecimiento Natural o Vegetativo
Numero de Matrimonios
Residentes en el Extranjero
Estadística del IRPF
Transacciones Inmobiliarias 3º Trimestre de 2024
Afiliados a la Seguridad Social a Febrero de 2025
Paro registrado a Febrero de 2025
Estadisticas Turismo a Diciembre de 2024
Matriculaciones vehículos en Mayo de 2024
Habitantes por Localidad
Habitantes en municipios cercanos
Habitantes provincia de Asturias 2024
(Ir al Índice)Evolución población 1900 hasta 2024
Habitantes segun lugar de nacimiento
Pirámide de población
Crecimiento Natural o Vegetativo
Numero de Matrimonios
Residentes en el Extranjero
Estadística del IRPF
Transacciones Inmobiliarias 3º Trimestre de 2024
Afiliados a la Seguridad Social a Febrero de 2025
Paro registrado a Febrero de 2025
Estadisticas Turismo a Diciembre de 2024
Matriculaciones vehículos en Mayo de 2024
Habitantes por Localidad
Habitantes en municipios cercanos
Habitantes provincia de Asturias 2024
Mapa edad edificaciones.
En el siguiente mapa se puede observar la edad de los edificios de Cangas del Narcea, los datos provienen del Catastro y están actualizados a Octubre de 2019 .
Cada color representa una década, excepto el Negro que representa todos los edificios anteriores a 1900,que suele ser el casco histórico, en el mapa puede apreciarse como ha sido el desarrollo urbanístico de Cangas del Narcea a lo largo del tiempo.
En la tabla posterior podemos ver la cantidad de superficie construida (en m2) por década,así como la posición que ocupa el municipio en un Top nacional y provincial para cada década.
En la tabla posterior podemos ver la cantidad de superficie construida (en m2) por década,así como la posición que ocupa el municipio en un Top nacional y provincial para cada década.
| Superficie Construida | ||||
| Decada | % Total | Top Provincial | Top Nacional* | |
| <1900 | 15.26% | <- 9º -> | <- 71º -> | |
| 1900-1909 | 17.14% | <- 10º -> | <- 94º -> | |
| 1910-1919 | 1.74% | <- 22º -> | <- 267º -> | |
| 1920-1929 | 1.98% | <- 24º -> | <- 742º -> | |
| 1930-1939 | 1.92% | <- 18º -> | <- 792º -> | |
| 1940-1949 | 2.20% | <- 21º -> | <- 973º -> | |
| 1950-1959 | 3.63% | <- 21º -> | <- 708º -> | |
| 1960-1969 | 7.01% | <- 24º -> | <- 676º -> | |
| 1970-1979 | 8.37% | <- 25º -> | <- 948º -> | |
| 1980-1989 | 19.61% | <- 11º -> | <- 479º -> | |
| 1990-1999 | 8.29% | <- 23º -> | <- 1080º -> | |
| 2000-2009 | 11.10% | <- 24º -> | <- 1291º -> | |
| 2010-2019 | 1.76% | <- 30º -> | <- 1278º -> | |
(Ir al Índice)
Evolución de la población desde 1900 hasta 2024.
Segun los datos publicados por el INE a 1 de Enero de 2024 el número de habitantes en Cangas del Narcea es de 11.421, 175 habitantes menos que el en el año 2023. En el grafico siguiente se puede ver cuantos habitantes tiene Cangas del Narcea a lo largo de los años.| Habitantes en otros municipios | ||
| Municipio | Habitantes | Diferencia (2023) |
| Oviedo | 220.543 | +2.959 |
| Valdés | 10.895 | -63 |
| Grado | 9.688 | +72 |
| Allande | 1.530 | -22 |
| Santo Adriano | 289 | +3 |
Actualmente la densidad de poblacion en Cangas del Narcea es de 13,87 habitantes por Km2.
Tabla con la evolución del número de hombres ,mujeres y total a lo largo de los años.
| Evolución de la población desde 1900 hasta 2024 | |||
| Año | Hombres | Mujeres | Total |
| 2024 | 5.551 | 5.870 | 11.421 |
| 2023 | 5.640 | 5.956 | 11.596 |
| 2022 | 5.768 | 6.049 | 11.817 |
| 2021 | 5.865 | 6.101 | 11.966 |
| 2020 | 5.951 | 6.173 | 12.124 |
| 2019 | 6.070 | 6.277 | 12.347 |
| 2018 | 6.196 | 6.383 | 12.579 |
| 2017 | 6.392 | 6.555 | 12.947 |
| 2016 | 6.556 | 6.657 | 13.213 |
| 2015 | 6.677 | 6.774 | 13.451 |
| 2014 | 6.813 | 6.897 | 13.710 |
| 2013 | 6.918 | 6.960 | 13.878 |
| 2012 | 7.032 | 7.045 | 14.077 |
| 2011 | 7.116 | 7.133 | 14.249 |
| 2010 | 7.219 | 7.226 | 14.445 |
| 2009 | 7.294 | 7.295 | 14.589 |
| 2008 | 7.407 | 7.389 | 14.796 |
| 2007 | 7.586 | 7.541 | 15.127 |
| 2006 | 7.745 | 7.692 | 15.437 |
| 2005 | 7.865 | 7.807 | 15.672 |
| 2004 | 8.031 | 7.980 | 16.011 |
| 2003 | 8.203 | 8.137 | 16.340 |
| 2002 | 8.356 | 8.256 | 16.612 |
| 2001 | 8.503 | 8.362 | 16.865 |
| 2000 | 8.676 | 8.485 | 17.161 |
| 1999 | 8.913 | 8.678 | 17.591 |
| 1998 | 9.042 | 8.770 | 17.812 |
| 1996 | 9.216 | 8.891 | 18.107 |
| 1995 | 9.579 | 9.203 | 18.782 |
| 1994 | 9.680 | 9.249 | 18.929 |
| 1993 | 9.810 | 9.347 | 19.157 |
| 1992 | 9.787 | 9.315 | 19.102 |
| 1991 | 9.847 | 9.378 | 19.225 |
| 1990 | 10.589 | 9.915 | 20.504 |
| 1989 | 10.559 | 9.879 | 20.438 |
| 1988 | 10.533 | 9.805 | 20.338 |
| 1987 | 10.450 | 9.712 | 20.162 |
| 1986 | 10.354 | 9.655 | 20.009 |
| 1981 | 0 | 0 | 19.738 |
| 1970 | 0 | 0 | 19.713 |
| 1960 | 0 | 0 | 20.980 |
| 1950 | 0 | 0 | 21.143 |
| 1940 | 0 | 0 | 21.296 |
| 1930 | 0 | 0 | 21.417 |
| 1920 | 0 | 0 | 23.668 |
| 1910 | 0 | 0 | 23.104 |
| 1900 | 0 | 0 | 22.742 |
(Ir al Índice)
Poblacion Máxima Estacional.
La población estacional máxima es una estimación de la población máxima que soporta Cangas del Narcea. En el cálculo se incluyen las personas que tienen algún tipo de vinculación o relación con el municipio, ya sea porque residen, trabajan, estudian o pasan algún período de tiempo en él. Los datos son publicados anualmente por el Ministerio de Hacienda y Administraciones Públicas, en colaboración con las Diputaciones Provinciales, Cabildos y Consejos Insulares.| Poblacion Estacional Máxima | |||
| Año | Personas | ||
| 2016 | 13.987 | ||
| 2015 | 14.233 | ||
| 2014 | 14.412 | ||
| 2013 | 14.595 | ||
| 2012 | 14.754 | ||
| 2011 | 14.871 | ||
| 2010 | 15.015 | ||
| 2009 | 15.217 | ||
| 2008 | 15.234 | ||
| 2005 | 16.421 | ||
| 2000 | 18.673 | ||
(Ir al Índice)
Habitantes segun lugar de nacimiento.
Según los datos publicados por el INE procedentes del padrón municipal de 2022 el 79.17% (9.355) de los habitantes empadronados en el Municipio de Cangas del Narcea han nacido en dicho municipio, el 16.70% han emigrado a Cangas del Narcea desde diferentes lugares de España, el 10.99% (1.299) desde otros municipios de la provincia de Asturias, el 5.71% (675) desde otras comunidades autónomas y el 4.13% (488) han emigrado a Cangas del Narcea desde otros países.
 |  |  |
En el siguiente gráfico podemos ver la evolución de la estructura de la población en el municipio de Cangas del Narcea si lo comparamos con 2021 vemos
- Disminuyen (-159) los habitantes nacidos en Cangas del Narcea, pasando del 79.51% al 79.17%.
- Disminuyen (-12) los habitantes nacidos en la provincia de Asturias, pasando del 10.96% al 10.99%.
- Aumentan (7) los habitantes nacidos en el resto de España, pasando del 5.58% al 5.71%.
- Aumentan (15) los habitantes nacidos en otros países, pasando del 3.95% al 4.13%.
- Disminuyen (-5.467) los habitantes nacidos en Cangas del Narcea, pasando del 81.84% al 79.17%.
- Disminuyen (-685) los habitantes nacidos en la provincia de Asturias, pasando del 10.96% al 10.99%.
- Disminuyen (-367) los habitantes nacidos en el resto de España, pasando del 5.75% al 5.71%.
- Aumentan (226) los habitantes nacidos en otros países, pasando del 1.45% al 4.13%.
 |  |  |
Segun los datos ofrecidos por el INE en la estadistica del Padrón los habitantes empadronados en Cangas del Narcea que han nacido en otros países ascienden a 488.
- 179 habitantes, 43 hombres y 136 mujeres nacidos en América.
- 75 habitantes, 43 hombres y 32 mujeres nacidos en África.
- 13 habitantes, 5 hombres y 8 mujeres nacidos en Asia.
- 3 habitantes, 2 hombres y 1 mujer nacidos en Oceanía.

 |  |  |
| Habitantes segun Pais de Nacimiento | |||
| Pais | 2022 | Dif (2021) | |
| Francia | 4 | -1 | |
| Italia | 4 | 2 | |
| Polonia | 12 | -10 | |
| Portugal | 46 | 0 | |
| Reino Unido | 6 | 2 | |
| Alemania | 7 | 0 | |
| Rumanía | 98 | -9 | |
| Ucrania | 3 | 0 | |
| Rusia | 2 | 0 | |
| Argelia | 2 | -1 | |
| Marruecos | 56 | 8 | |
| Senegal | 1 | 0 | |
| Cuba | 11 | 3 | |
| República Dominicana | 14 | 4 | |
| Argentina | 26 | -3 | |
| Brasil | 21 | 4 | |
| Colombia | 46 | 15 | |
| Chile | 5 | 2 | |
| Ecuador | 3 | 2 | |
| Paraguay | 13 | -1 | |
| Perú | 7 | 5 | |
| Uruguay | 2 | 0 | |
| Venezuela | 11 | -3 | |
| China | 8 | 0 | |
| Otros | 80 | -1 | |

 |  |  |
Teniendo en cuenta la proporción de habitantes nacidos en otro pais sobre la población total del municipio, hemos realizado un ranking, en el que la 1ª posición esta ocupada por el municipio con una proporción mayor de habitantes nacidos en otro pais, aquí puede verse en que lugar esta el municipio de Cangas del Narcea y sus municipios cercanos.
| Top Municipal % Habitantes nacidos en otro pais | |||
| Provincia | Municipio | Pos | % |
| Palencia | Boadilla de Rioseco | 2.894 | 9,91 |
| Asturias | Santo Adriano | 3.611 | 8,09 |
| Asturias | Tineo | 5.489 | 4,61 |
| Cantabria | San Pedro del Romeral | 5.784 | 4,13 |
| Asturias | Cangas del Narcea | 5.785 | 4,13 |
| Sevilla | Mairena del Alcor | 5.786 | 4,13 |
| Asturias | Allande | 5.938 | 3,88 |
| Asturias | Somiedo | 6.048 | 3,73 |
| Asturias | Degaña | 6.412 | 3,17 |
| Leon | Peranzanes | 7.553 | 1,14 |
 |  |  |
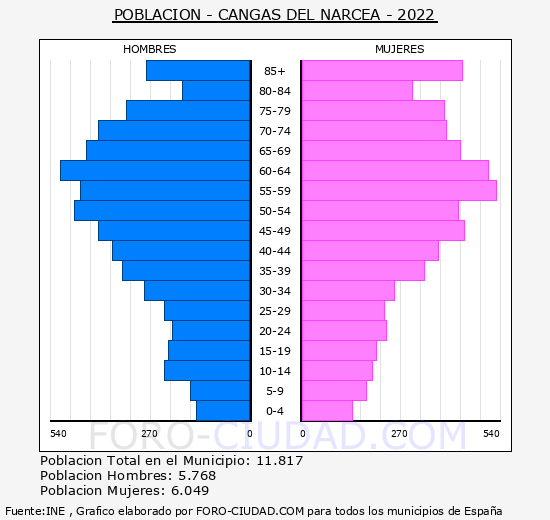
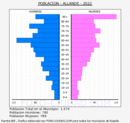
La media de edad de los habitantes de Cangas del Narcea es de 50,69 años, 1,91 años mas que hace un lustro que era de 48,78 años.
| Población de Cangas del Narcea por sexo y edad 2022 (grupos quinquenales) | |||
| Edad | Hombres | Mujeres | Total |
| 0-5 | 149 | 141 | 290 |
| 5-10 | 163 | 182 | 345 |
| 10-15 | 233 | 196 | 429 |
| 15-20 | 223 | 210 | 433 |
| 20-25 | 211 | 233 | 444 |
| 25-30 | 236 | 227 | 463 |
| 30-35 | 289 | 254 | 543 |
| 35-40 | 348 | 337 | 685 |
| 40-45 | 376 | 375 | 751 |
| 45-50 | 414 | 448 | 862 |
| 50-55 | 478 | 430 | 908 |
| 55-60 | 459 | 530 | 989 |
| 60-65 | 515 | 512 | 1.027 |
| 65-70 | 447 | 436 | 883 |
| 70-75 | 414 | 399 | 813 |
| 75-80 | 340 | 394 | 734 |
| 80-85 | 188 | 307 | 495 |
| 85- | 285 | 438 | 723 |
| Total | 5.768 | 6.049 | 11.817 |
La poblacion menor de 18 años en Cangas del Narcea es de 1.337 (700 H, 637 M ), el 11,3%.
La poblacion entre 18 y 65 años en Cangas del Narcea es de 7.044 (3.499 H, 3.545 M ), el 59,6%.
La poblacion mayor de 65 años en Cangas del Narcea es de 3.436 (1.569 H, 1.867 M ), el 29,1%.
 |  |  |
(Ir al Índice)
Crecimiento Natural o Vegetativo.
El crecimiento natural de la población en el municipio de Cangas del Narcea, según los últimos datos publicados por el INE para el año 2022 ha sido Negativo, con 154 defunciones mas que nacimientos.  |  |  |
Tabla con la evolución del número de nacimientos , defunciones y crecimiento vegetativo.
| Evolución Nacimientos y Defunciones desde 1996 hasta 2022 | |||
| Año | Nacimientos | Fallecidos | Diferencia |
| 2022 | 52 | 206 | -154 |
| 2021 | 50 | 185 | -135 |
| 2020 | 50 | 191 | -141 |
| 2019 | 59 | 202 | -143 |
| 2018 | 80 | 194 | -114 |
| 2017 | 60 | 191 | -131 |
| 2016 | 80 | 202 | -122 |
| 2015 | 74 | 207 | -133 |
| 2014 | 72 | 200 | -128 |
| 2013 | 63 | 167 | -104 |
| 2012 | 75 | 182 | -107 |
| 2011 | 75 | 198 | -123 |
| 2010 | 85 | 211 | -126 |
| 2009 | 94 | 194 | -100 |
| 2008 | 101 | 226 | -125 |
| 2007 | 97 | 208 | -111 |
| 2006 | 84 | 167 | -83 |
| 2005 | 89 | 186 | -97 |
| 2004 | 111 | 169 | -58 |
| 2003 | 99 | 184 | -85 |
| 2002 | 79 | 203 | -124 |
| 2001 | 112 | 185 | -73 |
| 2000 | 108 | 199 | -91 |
| 1999 | 103 | 191 | -88 |
| 1998 | 107 | 188 | -81 |
| 1997 | 103 | 202 | -99 |
| 1996 | 124 | 174 | -50 |
(Ir al Índice)
Evolución número de Matrimonios.
En el siguiente grafico y tabla podemos ver la evolución en el número de matrimonios que se han otorgado en el Municipio de Cangas del Narcea hasta el año 2022.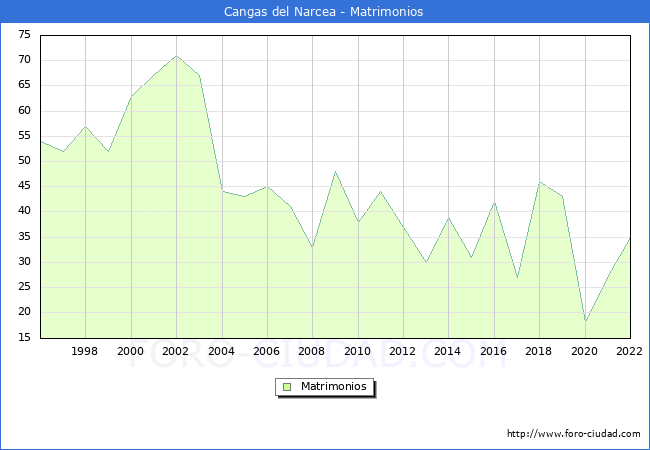
 |  |  |
| Evolución Matrimonios desde 1996 hasta 2022 | |
| Año | Matrimonios |
| 2022 | 35 |
| 2021 | 27 |
| 2020 | 18 |
| 2019 | 43 |
| 2018 | 46 |
| 2017 | 27 |
| 2016 | 42 |
| 2015 | 31 |
| 2014 | 39 |
| 2013 | 30 |
| 2012 | 37 |
| 2011 | 44 |
| 2010 | 38 |
| 2009 | 48 |
| 2008 | 33 |
| 2007 | 41 |
| 2006 | 45 |
| 2005 | 43 |
| 2004 | 44 |
| 2003 | 67 |
| 2002 | 71 |
| 2001 | 67 |
| 2000 | 63 |
| 1999 | 52 |
| 1998 | 57 |
| 1997 | 52 |
| 1996 | 54 |
(Ir al Índice)
Residentes en el extranjero.
Segun los datos publicados por el INE en el CERA, Censo Electoral de españoles residentes en el extranjero a 1 de Noviembre de 2024 los los españoles que residen habitualmente en el extranjero o han trasladado al extranjero su residencia habitual mayores de 18 años eran 2782 personas con municipio de origen en Cangas del Narcea.
 |  |  |
(Ir al Índice)
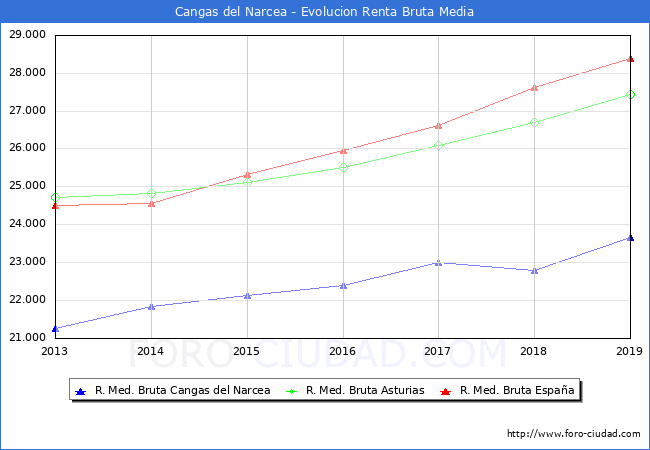
En 2019 Cangas del Narcea se sitúa como el municipio nº29 con una mayor renta bruta media en la comunidad de Asturias y el nº1632 a nivel Nacional (sin PV y Navarra), abajo se muestra una tabla con las posiciones en las que se encuentran los municipios cercanos y con población parecida.
Los habitantes de Cangas del Narcea liquidaron 15.621.451€ en concepto de IRPF en el año 2019 y recibieron por parte de las diferentes administraciones de forma directa en el presupuesto municipal (capitulo 4 Y 7) 5.560.651€ un 35,60% de lo aportado, en la siguiente tabla podemos ver las cifras de los municipios cercanos o de población similar.
Estadística del IRPF
Segun los datos hechos publicos por el Ministerio de Hacienda la renta bruta media por declarante, en el municipio de Cangas del Narcea en 2019 fue de 23.645€, 873€ mas que en el año 2018 . Una vez descontada la liquidacion por IRPF y lo aportado a la Seguridad Social la renta disponible media por declarante se situó en 19.947€, 807€ mas que en el año 2018.  |  |  |
| Evolución de la Renta Media en Cangas del Narcea | ||||
| Año | Renta Bruta | Var | Renta Dispo | Var |
| 2019 | 23.645€ | 873€ (3,69%) | 19.947€ | 807€ (4,05%) |
| 2018 | 22.772€ | -232€ (-1,02%) | 19.140€ | -115€ (-0,60%) |
| 2017 | 23.004€ | 620€ (2,70%) | 19.255€ | 474€ (2,46%) |
| 2016 | 22.384€ | 261€ (1,17%) | 18.781€ | 153€ (0,81%) |
| 2015 | 22.123€ | 289€ (1,31%) | 18.628€ | 473€ (2,54%) |
| 2014 | 21.834€ | 577€ (2,64%) | 18.155€ | 384€ (2,12%) |
| 2013 | 21.257€ | 0€ (0,00%) | 17.771€ | 0€ (0,00%) |
En 2019 Cangas del Narcea se sitúa como el municipio nº29 con una mayor renta bruta media en la comunidad de Asturias y el nº1632 a nivel Nacional (sin PV y Navarra), abajo se muestra una tabla con las posiciones en las que se encuentran los municipios cercanos y con población parecida.
| Renta Municipios Cercanos | ||||
| Municipio | Renta Bruta | Pos Prov | Pos Comu | Pos Naci |
| Oviedo (Asturias) | 30.468€ | 1 | 1 | 365 |
| Fuentes de Ebro (Zaragoza) | 23.652€ | 41 | 106 | 1631 |
| Cangas del Narcea (Asturias) | 23.645€ | 29 | 29 | 1632 |
| San Sebastián de la Gomera (Tenerife) | 23.644€ | 13 | 25 | 1633 |
| Grado (Asturias) | 23.588€ | 30 | 30 | 1649 |
| Santo Adriano (Asturias) | 23.318€ | 33 | 33 | 1743 |
| Valdés (Asturias) | 21.472€ | 48 | 48 | 2406 |
| Allande (Asturias) | 17.474€ | 65 | 65 | 4565 |
Los habitantes de Cangas del Narcea liquidaron 15.621.451€ en concepto de IRPF en el año 2019 y recibieron por parte de las diferentes administraciones de forma directa en el presupuesto municipal (capitulo 4 Y 7) 5.560.651€ un 35,60% de lo aportado, en la siguiente tabla podemos ver las cifras de los municipios cercanos o de población similar.
| Liquidación IPRF vs Presupuesto Ayuntamiento | |||
| Municipio | Liquidación | Capitulo 4 y 7 Presupuesto | % |
| Oviedo (Asturias) | 553.857.396€ | 58.879.484€ | 10,63 % |
| Fuentes de Ebro (Zaragoza) | 6.721.387€ | 2.539.180€ | 37,78 % |
| Cangas del Narcea (Asturias) | 15.621.451€ | 5.560.651€ | 35,60 % |
| San Sebastián de la Gomera (Tenerife) | 12.376.158€ | 9.965.549€ | 80,52 % |
| Grado (Asturias) | 11.451.050€ | 4.125.713€ | 36,03 % |
| Santo Adriano (Asturias) | 230.992€ | 345.635€ | 149,63 % |
| Valdés (Asturias) | 12.814.438€ | 4.092.197€ | 31,93 % |
| Allande (Asturias) | 1.059.447€ | 998.793€ | 94,27 % |
Indicadores de desigualdad.
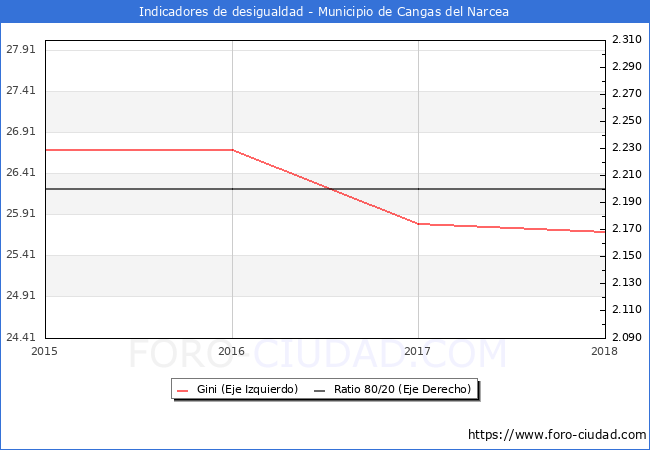
Íntimamente ligado a la pobreza se halla el concepto de desigualdad. Para entender mejor cómo afecta a la distribución de la renta en Cangas del Narcea, mostramos los valores de dos de los indicadores habituales encargados de reflejarla, el ratio 80/20 y el Índice de Gini.
En el año 2018 el Indice de Gini para Cangas del Narcea era de 25.70 y el ratio 80/20 era de 2.20.

Ratio 80/20 Cociente entre los ingresos totales del 20% de las personas con ingresos más elevados (percentil 80) y los ingresos totales del 20% de la población con menos ingresos (percentil 20).
El índice de Gini, es utilizado para analizar el grado de inequidad en la distribución respecto a los ingresos. Este indicador toma valores entre cero y uno (o entre 0 y 100 si se da en porcentaje); 0 cuando todas las personas tengan los mismos ingresos (perfecta igualdad), y 1 si todo el ingreso nacional está en manos de una única persona (perfecta desigualdad).
El índice de Gini, es utilizado para analizar el grado de inequidad en la distribución respecto a los ingresos. Este indicador toma valores entre cero y uno (o entre 0 y 100 si se da en porcentaje); 0 cuando todas las personas tengan los mismos ingresos (perfecta igualdad), y 1 si todo el ingreso nacional está en manos de una única persona (perfecta desigualdad).
| Indicadores en otros municipios | ||
| Municipio | Gini | Ratio 80/20 |
| Oviedo | 33.20 | 2.90 |
| Valdés | 26.70 | 2.10 |
| Grado | 29.40 | 2.50 |
| Allande | 25.80 | 2.10 |
| Santo Adriano | 30.70 | 2.60 |
| Precio de la vivienda en otros Municipios |
(Ir al Índice)
El nº total de Transacciones de vivienda hasta el 3º Trimestre de 2024 ha sido de 45 un 15.38% mas que en el mismo periodo de 2023 (39).
A continuación se muestra la evolución de los últimos años de forma grafica:
Transacciones Inmobiliarias 3ºT 2024
Segun los datos del 3º Trimestre del 2024 publicados por el Ministerio de Vivienda, el nº de transacciones inmobiliarias en el municipio de Cangas del Narcea asciende a un total de 17, el 6.25% mas que en el 3T de 2023,de las cuales 0 son transacciones de viviendas nuevas y 17 de segunda mano.El nº total de Transacciones de vivienda hasta el 3º Trimestre de 2024 ha sido de 45 un 15.38% mas que en el mismo periodo de 2023 (39).
A continuación se muestra la evolución de los últimos años de forma grafica:

 |  |  |
(Ir al Índice)


Este grafico no es una imagen fiel de la población en edad de trabajar del municipio, debido a que la Seguridad Social, publica los Afiliados por municipio teniendo en cuenta el centro de trabajo y no la residencia del trabajador, por tanto en los municipios como capitales administrativas o municipios dormitorio los datos se alejaran de la realidad por el movimiento de trabajadores entre municipios.
Afiliados a la Seguridad Social a Febrero de 2025 .
| Febrero 2025 | Total Afiliados | Variacion | |||
| Mensual | Anual | ||||
| Absoluta | Relativa | Absoluta | Relativa | ||
| Total | 3381 | +5 | 0.15 % | -26 | -0.76 % |
| REGIMEN: | |||||
| GENERAL | 1768 | +14 | 0.80 % | +25 | 1.43 % |
| AUTONOMOS | 1476 | -5 | -0.34 % | -60 | -3.91 % |
| AGRARIO | 19 | 0 | 0 % | +6 | 46.15 % |
| HOGAR | 59 | -5 | -7.81 % | -1 | -1.67 % |
| MAR | <5 | - | 0 % | - | 0 % |
| CARBON | 58 | 0 | 0 % | +4 | 7.41 % |

| Afiliación en otros municipios | ||
| Municipio | Afiliados | Dif. Mes Ant. |
| Oviedo | 129.298 | 576 |
| Valdés | 2.854 | -15 |
| Grado | 2.041 | 7 |
| Allande | 428 | 1 |
| Santo Adriano | 53 | -1 |

 |  |  |
(Ir al Índice)
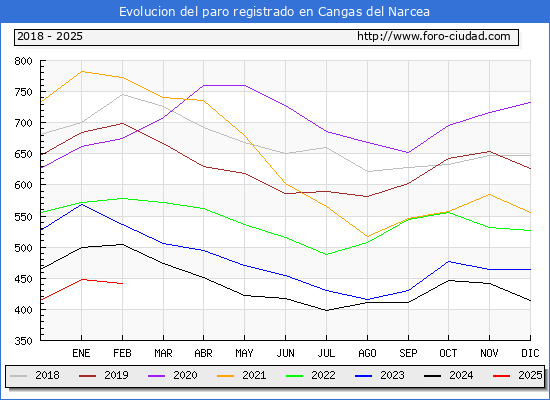
El número total de parados es de 442, de los cuales 171 son hombres y 271 mujeres.
Las personas mayores de 45 años con 265 parados son el grupo de edad mas afectado por el paro, seguido de los que se encuentran entre 25 y 44 años con 136 parados, el grupo menos numeroso son los menores de 25 años con 41 parados.
Por sectores vemos que en el sector servicios es donde mayor número de parados existe en el municipio con 300 personas, seguido de la agricultura con 40 parados, la construcción con 37 parados, las personas sin empleo anterior con 33 parados y por ultimo la industria con 32 parados.
Paro registrado a Febrero de 2025.
Segun los datos publicados por el SEPE en el mes de Febrero el número de parados ha bajado en 6 personas. De las 6 personas que salieron de la lista del paro en Cangas del Narcea descendio en 4 hombres y 2 mujeres.El número total de parados es de 442, de los cuales 171 son hombres y 271 mujeres.
Las personas mayores de 45 años con 265 parados son el grupo de edad mas afectado por el paro, seguido de los que se encuentran entre 25 y 44 años con 136 parados, el grupo menos numeroso son los menores de 25 años con 41 parados.
Por sectores vemos que en el sector servicios es donde mayor número de parados existe en el municipio con 300 personas, seguido de la agricultura con 40 parados, la construcción con 37 parados, las personas sin empleo anterior con 33 parados y por ultimo la industria con 32 parados.
| Febrero 2025 | Total Parados | Variacion | |||
| Mensual | Anual | ||||
| Absoluta | Relativa | Absoluta | Relativa | ||
| Total | 442 | -6 | -1.34 % | -62 | -12.30 % |
| HOMBRES | 171 | -4 | -2.29 % | -35 | -16.99 % |
| MUJERES | 271 | -2 | -0.73 % | -27 | -9.06 % |
| MENORES DE 25 AÑOS: | 41 | -6 | -12.77 % | -7 | -14.58 % |
| HOMBRES | 21 | -1 | -4.55 % | -7 | -25.00 % |
| MUJERES | 20 | -5 | -20.00 % | 0 | 0 % |
| ENTRE 25 Y 44 AÑOS | 136 | -4 | -2.86 % | -34 | -20.00 % |
| HOMBRES | 44 | +1719 | 3,508.16 % | -26 | -37.14 % |
| MUJERES | 92 | +1 | 1.10 % | -8 | -8.00 % |
| MAYORES DE 45 AÑOS | 265 | +4 | 1.53 % | -21 | -7.34 % |
| HOMBRES | 106 | +2 | 1.92 % | -2 | -1.85 % |
| MUJERES | 159 | +2 | 1.27 % | -19 | -10.67 % |
| SECTOR: | |||||
| AGRICULTURA | 40 | -2 | -4.76 % | -2 | -4.76 % |
| INDUSTRIA | 32 | -2 | -5.88 % | +7 | 28.00 % |
| CONSTRUCCIÓN | 37 | +1 | 2.78 % | -1 | -2.63 % |
| SERVICIOS | 300 | -5 | -1.64 % | -54 | -15.25 % |
| SIN EMPLEO ANTERIOR | 33 | +2 | 6.45 % | -12 | -26.67 % |

 |  |  |
(Ir al Índice)
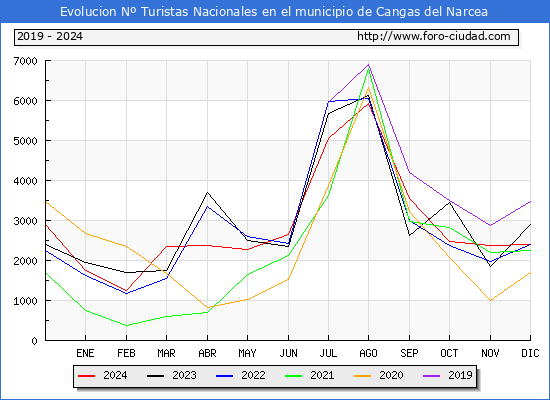
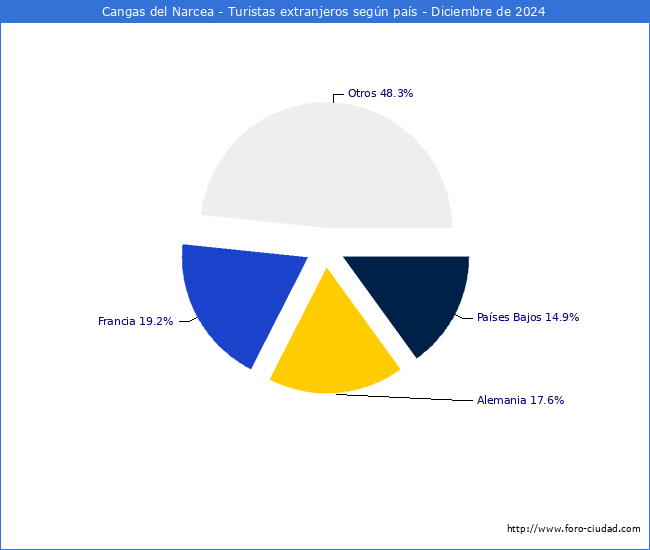
Los turistas de origen internacional ascendieron a 261 un 0,8% más que en el mismo mes de 2023 y el nº de turistas nacionales fue de 2.406 un -16,7% menos.
El nº total de turistas que han visitado Cangas del Narcea de Enero a Diciembre de 2024 ha sido de 38.689 un -5,1% menos que en el mismo periodo de 2023,el total de turistas de origen nacional ha sido de 34.439 (-5,9%) y los de origen internacional 4.250 (+1,8%).

Estadisticas turísticas a Diciembre de 2024.
En Diciembre de 2024 el Nº de turistas que visitaron* Cangas del Narcea fue de 2.667 un -15,3% menos que en Diciembre de 2023.Los turistas de origen internacional ascendieron a 261 un 0,8% más que en el mismo mes de 2023 y el nº de turistas nacionales fue de 2.406 un -16,7% menos.
El nº total de turistas que han visitado Cangas del Narcea de Enero a Diciembre de 2024 ha sido de 38.689 un -5,1% menos que en el mismo periodo de 2023,el total de turistas de origen nacional ha sido de 34.439 (-5,9%) y los de origen internacional 4.250 (+1,8%).


| Estadísticas turísticas en otros municipios | |||
| Municipio | Total Turistas Diciembre 2024 | Diferencia Diciembre 2023 | Top |
| Oviedo | 61.279 | +3.240 (5,6%) | 44 |
| Valdés | 2.865 | -118 (-4,0%) | 989 |
| Grado | 1.345 | +44 (3,4%) | 1.944 |
| Allande | 289 | +56 (24,0%) | 4.628 |
| Santo Adriano | 78 | +46 (143,8%) | 6.213 |
*:Se consideran viajes turísticos todos los desplazamientos con destino principal fuera del lugar de residencia habitual de la persona, que implique una pernoctación fuera del mismo.
 |  |  |
(Ir al Índice)
Matriculaciones vehículos en Mayo de 2024 .
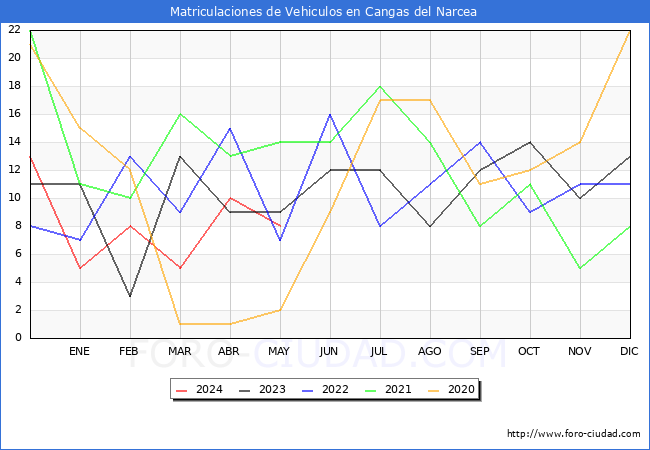
| Matriculaciones | Mayo 2024 | Mayo 2023 | 12 Meses Interanual | 12 Meses Anteriores | ||||
| Mat | Dif | % | Mat | Dif | % | |||
| TOTAL | 8 | 9 | -1 | -11.11 % | 117 | 125 | -8 | -6.40 % |
| TURISMOS | 2 | 6 | -4 | -66.67 % | 55 | 52 | +3 | 5.77 % |
| CAMIONES | 0 | 0 | 0 | 0.00 % | 4 | 6 | -2 | -33.33 % |
| AUTOBUSES | 0 | 0 | 0 | 0.00 % | 1 | 1 | 0 | 0.00 % |
| CAMIONETAS | 0 | 0 | 0 | 0.00 % | 4 | 7 | -3 | -42.86 % |
| TRACTORES | 0 | 0 | 0 | 0.00 % | 14 | 13 | +1 | 7.69 % |
| MOTOCICLETAS | 3 | 0 | +3 | 100.00 % | 21 | 30 | -9 | -30.00 % |
| CICLOMOTORES | 0 | 0 | 0 | 0.00 % | 1 | 1 | 0 | 0.00 % |
| OTROS | 3 | 3 | 0 | 0.00 % | 17 | 15 | +2 | 13.33 % |
| Matriculaciones en otros municipios | ||
| Municipio | Matriculaciones Mayo 2024 | Diferencia Mayo 2023 |
| Oviedo | 360 | +17 (4.96%) |
| Valdés | 15 | +2 (15.38%) |
| Grado | 7 | -3 (-30.00%) |
| Allande | 0 | -4 (-100.00%) |
| Santo Adriano | 1 | +1 (100.00%) |

 |  |  |
(Ir al Índice)
Habitantes en localidades del Municipio.
- Abanceña (2000-2023)
- Aciu (2000-2023)
- Adralés (2000-2023)
- Amáu (2000-2023)
- Ambres (2000-2023)
- Anderbe (2000-2023)
- Antráu (2000-2023)
- Araniegu (2000-2023)
- Arbas (2000-2023)
- Arbolente (2000-2023)
- Augüera (2000-2023)
- Barnéu (2000-2023)
- Becerrales (2000-2023)
- Bendiel.lu (2000-2023)
- Bergame (2000-2023)
- Bergame d'Abaxu (2000-2023)
- Bergame d'Arriba (2000-2023)
- Berguñu (2000-2023)
- Bimeda (2000-2023)
- Bisuyu (2000-2023)
- Bornazal (2000-2023)
- Borracán (2000-2023)
- Brañas d'Abaxu (2000-2023)
- Brañas d'Arriba (2000-2023)
- Brañas/Leitariegos (2000-2023)
- Brixemada (2000-2023)
- Bruel.les (2000-2023)
- Cadrixuela (2000-2023)
- Caldevil.la d'Aciu (2000-2023)
- Caldevil.la d'Arbas (2000-2023)
- Caldevil.la de Rengos (2000-2023)
- Carbachu (2000-2023)
- Carbaéu (2000-2023)
- Carceda (2000-2023)
- Castañéu (2000-2023)
- Castilmoure (2000-2023)
- Castru de L.lúmés (2000-2023)
- Castru Sierra (2000-2023)
- Castrusín (2000-2023)
- Chanu (2000-2023)
- Cibea (2000-2023)
- Cibuyu (2000-2023)
- Ciérades (2000-2023)
- Combarru (2000-2023)
- Combu (2000-2023)
- Corveiru (2000-2023)
- Coubos (2000-2023)
- Courias (2000-2023)
- Cruces (2000-2023)
- Cueiras (2000-2023)
- Dagueñu (2000-2023)
- El Cabanal (2000-2023)
- El Cadal.leitu (2000-2023)
- El Pinar (2000-2023)
- El Pládanu (2000-2023)
- El Pueblu (2000-2023)
- El Puelu (2000-2023)
- El Puertu (2000-2023)
- El Pumar (2000-2023)
- El Visu (2000-2023)
- Escrita (2000-2023)
- Feidiel (2000-2023)
- Folgueirúa (2000-2023)
- Folgueraxú (2000-2023)
- Fonceca (2000-2023)
- Fontes de Corveiru (2000-2023)
- Fontes de las Montañas (2000-2023)
- Fontesdevil.la (2000-2023)
- L'Abechera (2000-2023)
- L'Acebu (2000-2023)
- L'Artosa (2000-2023)
- L'Outeiru (2000-2023)
- L'Outriel.lu (2000-2023)
- L.ladréu (2000-2023)
- L.lamas del Mouru (2000-2023)
- L.lamera (2000-2023)
- L.Larón (2000-2023)
- L.lavachos (2000-2023)
- L.linares (2000-2023)
- L.lindouta (2000-2023)
- L.lourante (2000-2023)
- L.luberiu (2000-2023)
- L.lugarnes (2000-2023)
- L.lúmés (2000-2023)
- La Braña d'Ordial (2000-2023)
- La Cogol.la (2000-2023)
- La Cuitada (2000-2023)
- La Farruquita (2000-2023)
- La Gubia (2000-2023)
- La L.linde (2000-2023)
- La Mouriel.la (2000-2023)
- La Nisal (2000-2023)
- La Pacharina (2000-2023)
- La Pescal (2000-2023)
- La Riela (2000-2023)
- La Veiga'l Tachu (2000-2023)
- La Veiguiel.la (2000-2023)
- La Venta (2000-2023)
- La Viliel.la (2000-2023)
- Larna (2000-2023)
- Las Cuadriel.las d'Ambres (2000-2023)
- Las Cuadriel.las de Vil.lalái (2000-2023)
- Las Defradas (2000-2023)
- Las Defrades (2000-2023)
- Las Frauguas (2000-2023)
- Las Montañas (2000-2023)
- Las Tiendas (2000-2023)
- Los Eiros (2000-2023)
- Los Tablaos (2000-2023)
- Maganes (2000-2023)
- Medéu (2000-2023)
- Mieldes (2000-2023)
- Monasteriu (2000-2023)
- Moncóu (2000-2023)
- Monesteriu d'Ermu (2000-2023)
- Morzóu (2000-2023)
- Mual (2000-2023)
- Murias de Paronche (2000-2023)
- Nandu (2000-2023)
- Naviegu (2000-2023)
- Olgu (2000-2023)
- Ordial (2000-2023)
- Oubachu (2000-2023)
- Oubanca (2000-2023)
- Ounón (2000-2023)
- Outás (2000-2023)
- Pambléi (2000-2023)
- Parada la Nueva (2000-2023)
- Parada la Viecha (2000-2023)
- Parandones (2000-2023)
- Parrondu (2000-2023)
- Penas (2000-2023)
- Perdiel.lu (2000-2023)
- Piedrafita (2000-2023)
- Pinl.lés (2000-2023)
- Pixán (2000-2023)
- Pontarás (2000-2023)
- Pontelinfiernu (2000-2023)
- Porl.léi (2000-2023)
- Pousada de Bisuyu (2000-2023)
- Pousada de Rengos (2000-2023)
- Rañeces de Sierra (2000-2023)
- Ratu (2000-2023)
- Rebol.las (2000-2023)
- Retornu (2000-2023)
- Retuertas (2000-2023)
- Ridera (2000-2023)
- Riegla de Cibea (2000-2023)
- Riegla de Naviegu (2000-2023)
- Rimolín (2000-2023)
- Robléu (2000-2023)
- Robléu Biforcu (2000-2023)
- Robléu de Teinás (2000-2023)
- Rubial (2000-2023)
- Rucabu (2000-2023)
- Samartín (2000-2023)
- Samartinu (2000-2023)
- San Fliz (2000-2023)
- San Pedru Culiema (2000-2023)
- San Pedru d'Arbas (2000-2023)
- San Pedru de Courias (2000-2023)
- San Pedru las Montañas (2000-2023)
- San Romanu d'Arbas (2000-2023)
- San Romanu de Bisuyu (2000-2023)
- San Tisu (2000-2023)
- San Xuan del Monte (2000-2023)
- San Xulianu (2000-2023)
- Sanabuega (2000-2023)
- Sanmartinu los Eiros (2000-2023)
- Santa Marina (2000-2023)
- Santiagu (2000-2023)
- Santiáu de Sierra (2000-2023)
- Santuyanu (2000-2023)
- Sasturrasu (2000-2023)
- Saúrcio (2000-2023)
- Sebil (2000-2023)
- Siasu (2000-2023)
- Sienra (2000-2023)
- Sierra de Castanéu (2000-2023)
- Socarral (2000-2023)
- Sonande (2000-2023)
- Sorrodiles (2000-2023)
- Soucéu (2000-2023)
- Soutiel.lu (2000-2023)
- Soutu de Cibuyu (2000-2023)
- Soutu los Molinos (2000-2023)
- Tabladiel.lu (2000-2023)
- Tabláu (2000-2023)
- Tandes (2000-2023)
- Tardexugu (2000-2023)
- Teinás (2000-2023)
- Tremáu de Carbachu (2000-2023)
- Tremáu del Coutu (2000-2023)
- Trescastru (2000-2023)
- Tresmonte d'Abaxu (2000-2023)
- Tresmonte d'Arriba (2000-2023)
- Trones (2000-2023)
- Tubongu (2000-2023)
- Uviéi (2000-2023)
- Val.láu (2000-2023)
- Val.liciel.lu (2000-2023)
- Val.linas (2000-2023)
- Valcabu (2000-2023)
- Valmayor (2000-2023)
- Vecil (2000-2023)
- Veiga (2000-2023)
- Veiga de Rengos (2000-2023)
- Veigadhorru (2000-2023)
- Veigaimiedru (2000-2023)
- Veigaipope (2000-2023)
- Veigal.lagar (2000-2023)
- Veigalcastru (2000-2023)
- Vialar (2000-2023)
- Vidal (2000-2023)
- Vil.lacibrán (2000-2023)
- Vil.ladestre (2000-2023)
- Vil.lalái (2000-2023)
- Vil.lamental (2000-2023)
- Vil.lar d'Adralés (2000-2023)
- Vil.lar de Bergame (2000-2023)
- Vil.lar de Bimeda (2000-2023)
- Vil.lar de L.lanteiru (2000-2023)
- Vil.lar de Naviegu (2000-2023)
- Vil.lar de Pousada (2000-2023)
- Vil.lar de Rogueiru (2000-2023)
- Vil.larín de Cibea (2000-2023)
- Vil.larín de L.lúmés (2000-2023)
- Vil.latexil (2000-2023)
- Vil.laxer (2000-2023)
- Vil.laxur (2000-2023)
- Vil.louril de Bimeda (2000-2023)
- Vil.louril de Sierra (2000-2023)
- Villaláez (2000-2023)
- Xalón (2000-2023)
- Xarceléi (2000-2023)
- Xavita (2000-2023)
- Xedré (2000-2023)
- Xichón/Gillón (2000-2023)
- Xilán (2000-2023)
- Xinestosu (2000-2023)
- Zreicéu (2000-2023)
- Zreizalí (2000-2023)
Elaboracion:Foro-ciudad.com (Se puede usar todo el contenido, insertando link a esta pagina).
Fuentes:
Instituto Nacional de Estadística
1900-1981: Poblaciones de hecho desde 1900 hasta 1991. Cifras oficiales sacadas de los Censos respectivos.
1986-1995: Poblaciones de derecho desde 1986 hasta 1995. Cifras de las rectificaciones y renovaciones Padrónales.
1996-2024: Cifras Oficiales de Población de los Municipios Españoles:Revisión del Padrón Municipal.
Medición del turismo a partir de la posición de los teléfonos móviles.
Ministerio de Hacienda y Administraciones Públicas
Agencia Tributaria
Servicio Público de Empleo Estatal
Seguridad Social
Ministerio de Fomento
DGT
Catastro *Datos no disponibles para Navarra y Pais Vasco.


