Demografia de Olazti/Olazagutía
Esta información pretende ofrecer una visión actual de la información demográfica puesta a disposición por el INE a través de sus diferentes publicaciones estadísticas, sobre todo usando como fuente el Padrón Municipal que se actualiza anualmente.
Evolución población 1900 hasta 2024
Habitantes segun lugar de nacimiento
Pirámide de población
Crecimiento Natural o Vegetativo
Numero de Matrimonios
Residentes en el Extranjero
Transacciones Inmobiliarias 3º Trimestre de 2024
Afiliados a la Seguridad Social a Febrero de 2025
Paro registrado a Febrero de 2025
Estadisticas Turismo a Diciembre de 2024
Matriculaciones vehículos en Mayo de 2024
Habitantes en municipios cercanos
Habitantes provincia de Navarra 2024
(Ir al Índice)
Evolución de la población desde 1900 hasta 2024.
Segun los datos publicados por el INE a 1 de Enero de 2024 el número de habitantes en Olazti/Olazagutía es de 1.464, 19 habitantes menos que el en el año 2023. En el grafico siguiente se puede ver cuantos habitantes tiene Olazti/Olazagutía a lo largo de los años.| Habitantes en otros municipios | ||
| Municipio | Habitantes | Diferencia (2023) |
| Pamplona/Iruña | 207.777 | +2.015 |
| Altsasu/Alsasua | 7.710 | +120 |
| Lazkao | 6.055 | +42 |
| Ziordia | 353 | +1 |
| Urdiain | 642 | +4 |
Actualmente la densidad de poblacion en Olazti/Olazagutía es de 76,30 habitantes por Km2.
Tabla con la evolución del número de hombres ,mujeres y total a lo largo de los años.
| Evolución de la población desde 1900 hasta 2024 | |||
| Año | Hombres | Mujeres | Total |
| 2024 | 746 | 718 | 1.464 |
| 2023 | 752 | 731 | 1.483 |
| 2022 | 764 | 726 | 1.490 |
| 2021 | 752 | 733 | 1.485 |
| 2020 | 751 | 739 | 1.490 |
| 2019 | 753 | 736 | 1.489 |
| 2018 | 762 | 735 | 1.497 |
| 2017 | 781 | 737 | 1.518 |
| 2016 | 786 | 736 | 1.522 |
| 2015 | 776 | 744 | 1.520 |
| 2014 | 794 | 758 | 1.552 |
| 2013 | 839 | 788 | 1.627 |
| 2012 | 853 | 809 | 1.662 |
| 2011 | 885 | 811 | 1.696 |
| 2010 | 899 | 820 | 1.719 |
| 2009 | 914 | 823 | 1.737 |
| 2008 | 885 | 802 | 1.687 |
| 2007 | 918 | 821 | 1.739 |
| 2006 | 921 | 841 | 1.762 |
| 2005 | 903 | 827 | 1.730 |
| 2004 | 879 | 825 | 1.704 |
| 2003 | 875 | 822 | 1.697 |
| 2002 | 887 | 824 | 1.711 |
| 2001 | 872 | 809 | 1.681 |
| 2000 | 856 | 798 | 1.654 |
| 1999 | 854 | 806 | 1.660 |
| 1998 | 837 | 793 | 1.630 |
| 1996 | 831 | 789 | 1.620 |
| 1995 | 888 | 810 | 1.698 |
| 1994 | 900 | 828 | 1.728 |
| 1993 | 897 | 830 | 1.727 |
| 1992 | 897 | 831 | 1.728 |
| 1991 | 889 | 824 | 1.713 |
| 1990 | 939 | 864 | 1.803 |
| 1989 | 944 | 870 | 1.814 |
| 1988 | 934 | 855 | 1.789 |
| 1987 | 951 | 885 | 1.836 |
| 1986 | 959 | 893 | 1.852 |
| 1981 | 0 | 0 | 1.969 |
| 1970 | 0 | 0 | 2.012 |
| 1960 | 0 | 0 | 2.097 |
| 1950 | 0 | 0 | 1.643 |
| 1940 | 0 | 0 | 1.624 |
| 1930 | 0 | 0 | 1.682 |
| 1920 | 0 | 0 | 1.261 |
| 1910 | 0 | 0 | 1.035 |
| 1900 | 0 | 0 | 780 |
(Ir al Índice)
Habitantes segun lugar de nacimiento.
Según los datos publicados por el INE procedentes del padrón municipal de 2022 el 34.70% (517) de los habitantes empadronados en el Municipio de Olazti/Olazagutía han nacido en dicho municipio, el 49.40% han emigrado a Olazti/Olazagutía desde diferentes lugares de España, el 34.03% (507) desde otros municipios de la provincia de Navarra, el 15.37% (229) desde otras comunidades autónomas y el 15.91% (237) han emigrado a Olazti/Olazagutía desde otros países.
 |  |  |
| Estructura en otros Municipios |
En el siguiente gráfico podemos ver la evolución de la estructura de la población en el municipio de Olazti/Olazagutía si lo comparamos con 2021 vemos
- Disminuyen (-2) los habitantes nacidos en Olazti/Olazagutía, pasando del 34.95% al 34.70%.
- Disminuyen (-9) los habitantes nacidos en la provincia de Navarra, pasando del 34.75% al 34.03%.
- Disminuyen (-2) los habitantes nacidos en el resto de España, pasando del 15.56% al 15.37%.
- Aumentan (18) los habitantes nacidos en otros países, pasando del 14.75% al 15.91%.
- Disminuyen (-75) los habitantes nacidos en Olazti/Olazagutía, pasando del 36.54% al 34.70%.
- Disminuyen (-182) los habitantes nacidos en la provincia de Navarra, pasando del 42.53% al 34.03%.
- Disminuyen (-83) los habitantes nacidos en el resto de España, pasando del 19.26% al 15.37%.
- Aumentan (210) los habitantes nacidos en otros países, pasando del 1.67% al 15.91%.
 |  |  |
Segun los datos ofrecidos por el INE en la estadistica del Padrón los habitantes empadronados en Olazti/Olazagutía que han nacido en otros países ascienden a 237.
- 107 habitantes, 62 hombres y 45 mujeres nacidos en África.
- 63 habitantes, 23 hombres y 40 mujeres nacidos en América.

 |  |  |
| Habitantes segun Pais de Nacimiento | |||
| Pais | 2022 | Dif (2021) | |
| Bulgaria | 11 | 0 | |
| Francia | 2 | 0 | |
| Portugal | 19 | -1 | |
| Alemania | 1 | 0 | |
| Rumanía | 30 | 4 | |
| Argelia | 3 | 0 | |
| Marruecos | 77 | 7 | |
| Senegal | 14 | 1 | |
| Cuba | 3 | 0 | |
| República Dominicana | 3 | 0 | |
| Argentina | 1 | 0 | |
| Bolivia | 4 | 1 | |
| Brasil | 2 | 1 | |
| Colombia | 1 | 0 | |
| Chile | 2 | 0 | |
| Ecuador | 16 | -1 | |
| Paraguay | 2 | 2 | |
| Perú | 5 | 0 | |
| Uruguay | 1 | 1 | |
| Venezuela | 2 | 1 | |
| Otros | 38 | 3 | |

 |  |  |
Teniendo en cuenta la proporción de habitantes nacidos en otro pais sobre la población total del municipio, hemos realizado un ranking, en el que la 1ª posición esta ocupada por el municipio con una proporción mayor de habitantes nacidos en otro pais, aquí puede verse en que lugar esta el municipio de Olazti/Olazagutía y sus municipios cercanos.
| Top Municipal % Habitantes nacidos en otro pais | |||
| Provincia | Municipio | Pos | % |
| Teruel | Sarrión | 628 | 20,65 |
| Castellon | Viver | 1.251 | 15,91 |
| Navarra | Olazti/Olazagutía | 1.252 | 15,91 |
| Soria | San Leonardo de Yagüe | 1.253 | 15,91 |
| Navarra | Altsasu/Alsasua | 1.894 | 13,03 |
| Navarra | Iturmendi | 2.356 | 11,43 |
| Navarra | Ziordia | 3.857 | 7,51 |
| Navarra | Bakaiku | 5.066 | 5,35 |
| Navarra | Urdiain | 5.071 | 5,35 |
| Navarra | Eulate | 7.228 | 1,82 |
 |  |  |
| Pirámide en otros Municipios |
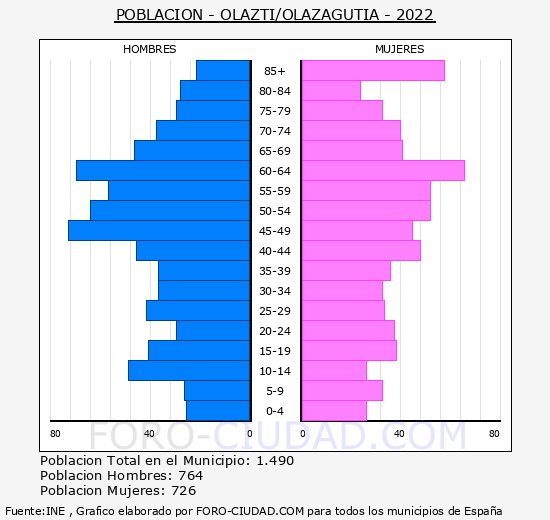
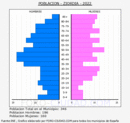
La media de edad de los habitantes de Olazti/Olazagutía es de 46,39 años, 0,54 años mas que hace un lustro que era de 45,85 años.
| Población de Olazti/Olazagutía por sexo y edad 2022 (grupos quinquenales) | |||
| Edad | Hombres | Mujeres | Total |
| 0-5 | 26 | 27 | 53 |
| 5-10 | 27 | 33 | 60 |
| 10-15 | 49 | 27 | 76 |
| 15-20 | 41 | 39 | 80 |
| 20-25 | 30 | 38 | 68 |
| 25-30 | 42 | 34 | 76 |
| 30-35 | 37 | 33 | 70 |
| 35-40 | 37 | 36 | 73 |
| 40-45 | 46 | 48 | 94 |
| 45-50 | 73 | 45 | 118 |
| 50-55 | 64 | 52 | 116 |
| 55-60 | 57 | 52 | 109 |
| 60-65 | 70 | 66 | 136 |
| 65-70 | 47 | 41 | 88 |
| 70-75 | 38 | 40 | 78 |
| 75-80 | 30 | 33 | 63 |
| 80-85 | 28 | 24 | 52 |
| 85- | 22 | 58 | 80 |
| Total | 764 | 726 | 1.490 |
La poblacion menor de 18 años en Olazti/Olazagutía es de 242 (135 H, 107 M ), el 16,2%.
La poblacion entre 18 y 65 años en Olazti/Olazagutía es de 909 (475 H, 434 M ), el 61,0%.
La poblacion mayor de 65 años en Olazti/Olazagutía es de 339 (154 H, 185 M ), el 22,8%.
 |  |  |
(Ir al Índice)
Crecimiento Natural o Vegetativo.
El crecimiento natural de la población en el municipio de Olazti/Olazagutía, según los últimos datos publicados por el INE para el año 2022 ha sido Negativo, con 9 defunciones mas que nacimientos.  |  |  |
Tabla con la evolución del número de nacimientos , defunciones y crecimiento vegetativo.
| Evolución Nacimientos y Defunciones desde 1996 hasta 2022 | |||
| Año | Nacimientos | Fallecidos | Diferencia |
| 2022 | 7 | 16 | -9 |
| 2021 | 11 | 18 | -7 |
| 2020 | 11 | 21 | -10 |
| 2019 | 7 | 13 | -6 |
| 2018 | 10 | 13 | -3 |
| 2017 | 13 | 18 | -5 |
| 2016 | 9 | 15 | -6 |
| 2015 | 13 | 15 | -2 |
| 2014 | 11 | 18 | -7 |
| 2013 | 9 | 25 | -16 |
| 2012 | 18 | 13 | 5 |
| 2011 | 20 | 14 | 6 |
| 2010 | 19 | 23 | -4 |
| 2009 | 14 | 14 | 0 |
| 2008 | 14 | 17 | -3 |
| 2007 | 11 | 14 | -3 |
| 2006 | 20 | 17 | 3 |
| 2005 | 22 | 14 | 8 |
| 2004 | 15 | 20 | -5 |
| 2003 | 21 | 13 | 8 |
| 2002 | 9 | 18 | -9 |
| 2001 | 13 | 11 | 2 |
| 2000 | 12 | 17 | -5 |
| 1999 | 12 | 17 | -5 |
| 1998 | 14 | 16 | -2 |
| 1997 | 9 | 12 | -3 |
| 1996 | 14 | 14 | 0 |
(Ir al Índice)
Evolución número de Matrimonios.
En el siguiente grafico y tabla podemos ver la evolución en el número de matrimonios que se han otorgado en el Municipio de Olazti/Olazagutía hasta el año 2022.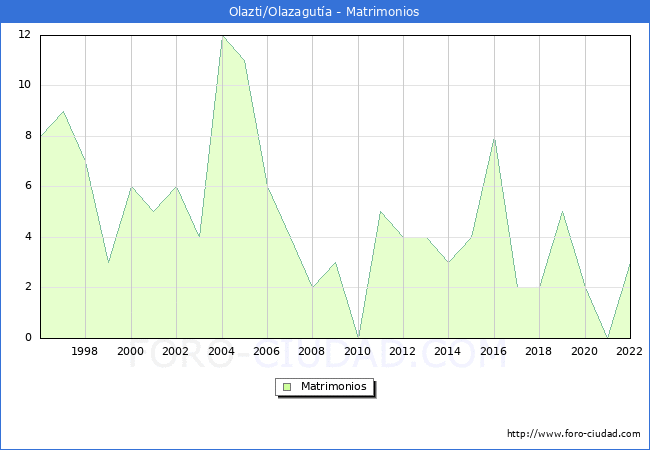
 |  |  |
| Evolución Matrimonios desde 1996 hasta 2022 | |
| Año | Matrimonios |
| 2022 | 3 |
| 2021 | 0 |
| 2020 | 2 |
| 2019 | 5 |
| 2018 | 2 |
| 2017 | 2 |
| 2016 | 8 |
| 2015 | 4 |
| 2014 | 3 |
| 2013 | 4 |
| 2012 | 4 |
| 2011 | 5 |
| 2010 | 0 |
| 2009 | 3 |
| 2008 | 2 |
| 2007 | 4 |
| 2006 | 6 |
| 2005 | 11 |
| 2004 | 12 |
| 2003 | 4 |
| 2002 | 6 |
| 2001 | 5 |
| 2000 | 6 |
| 1999 | 3 |
| 1998 | 7 |
| 1997 | 9 |
| 1996 | 8 |
(Ir al Índice)
Residentes en el extranjero.
Segun los datos publicados por el INE en el CERA, Censo Electoral de españoles residentes en el extranjero a 1 de Noviembre de 2024 los los españoles que residen habitualmente en el extranjero o han trasladado al extranjero su residencia habitual mayores de 18 años eran 71 personas con municipio de origen en Olazti/Olazagutía.
 |  |  |
| Precio de la vivienda en otros Municipios |
(Ir al Índice)
El nº total de Transacciones de vivienda hasta el 3º Trimestre de 2024 ha sido de 12 un 100.00% mas que en el mismo periodo de 2023 (6).
A continuación se muestra la evolución de los últimos años de forma grafica:
Transacciones Inmobiliarias 3ºT 2024
Segun los datos del 3º Trimestre del 2024 publicados por el Ministerio de Vivienda, el nº de transacciones inmobiliarias en el municipio de Olazti/Olazagutía asciende a un total de 3, el 50.00% mas que en el 3T de 2023,de las cuales 0 son transacciones de viviendas nuevas y 3 de segunda mano.El nº total de Transacciones de vivienda hasta el 3º Trimestre de 2024 ha sido de 12 un 100.00% mas que en el mismo periodo de 2023 (6).
A continuación se muestra la evolución de los últimos años de forma grafica:

 |  |  |
(Ir al Índice)


Este grafico no es una imagen fiel de la población en edad de trabajar del municipio, debido a que la Seguridad Social, publica los Afiliados por municipio teniendo en cuenta el centro de trabajo y no la residencia del trabajador, por tanto en los municipios como capitales administrativas o municipios dormitorio los datos se alejaran de la realidad por el movimiento de trabajadores entre municipios.
Afiliados a la Seguridad Social a Febrero de 2025 .
| Febrero 2025 | Total Afiliados | Variacion | |||
| Mensual | Anual | ||||
| Absoluta | Relativa | Absoluta | Relativa | ||
| Total | 548 | +1 | 0.18 % | +3 | 0.55 % |
| REGIMEN: | |||||
| GENERAL | 471 | 0 | 0 % | +8 | 1.73 % |
| AUTONOMOS | 72 | +2 | 2.86 % | 0 | 0 % |
| AGRARIO | 0 | 0 | 0 % | 0 | 0 % |
| HOGAR | 5 | 0 | 0 % | -5 | -50.00 % |
| MAR | 0 | 0 | 0 % | 0 | 0 % |
| CARBON | 0 | 0 | 0 % | 0 | 0 % |

| Afiliación en otros municipios | ||
| Municipio | Afiliados | Dif. Mes Ant. |
| Pamplona/Iruña | 117.598 | 1.178 |
| Altsasu/Alsasua | 2.578 | -4 |
| Lazkao | 1.486 | 18 |
| Ziordia | 84 | 0 |
| Urdiain | 261 | 3 |

 |  |  |
(Ir al Índice)
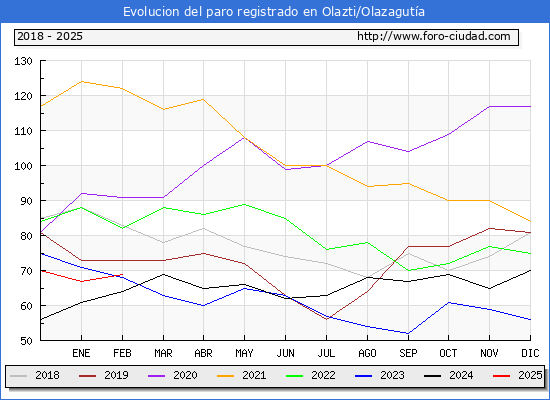
El número total de parados es de 69, de los cuales 27 son hombres y 36 mujeres.
Las personas mayores de 45 años con 33 parados son el grupo de edad mas afectado por el paro, seguido de los que se encuentran entre 25 y 44 años con 30 parados, el grupo menos numeroso son los menores de 25 años con 0 parados.
Por sectores vemos que en la agricultura es donde mayor número de parados existe en el municipio con <5 personas, seguido de el sector servicios con 36 parados, la industria con 20 parados, las personas sin empleo anterior con 12 parados y por ultimo la construcción con 0 parados.
Paro registrado a Febrero de 2025.
Segun los datos publicados por el SEPE en el mes de Febrero el número de parados ha subido en 2 personas. De las 2 personas nuevas en de la lista del paro en Olazti/Olazagutía no vario entre los hombres y aumento en 1 mujeres.El número total de parados es de 69, de los cuales 27 son hombres y 36 mujeres.
Las personas mayores de 45 años con 33 parados son el grupo de edad mas afectado por el paro, seguido de los que se encuentran entre 25 y 44 años con 30 parados, el grupo menos numeroso son los menores de 25 años con 0 parados.
Por sectores vemos que en la agricultura es donde mayor número de parados existe en el municipio con <5 personas, seguido de el sector servicios con 36 parados, la industria con 20 parados, las personas sin empleo anterior con 12 parados y por ultimo la construcción con 0 parados.
| Febrero 2025 | Total Parados | Variacion | |||
| Mensual | Anual | ||||
| Absoluta | Relativa | Absoluta | Relativa | ||
| Total | 69 | +2 | 2.99 % | +5 | 7.81 % |
| HOMBRES | 27 | 0 | 0 % | +1 | 3.85 % |
| MUJERES | 36 | +1 | 2.86 % | -1 | -2.70 % |
| MENORES DE 25 AÑOS: | 0 | - | 0 % | - | 0 % |
| HOMBRES | <5 | - | 0 % | - | 0 % |
| MUJERES | <5 | - | 0 % | - | 0 % |
| ENTRE 25 Y 44 AÑOS | 30 | +2 | 7.14 % | +5 | 20.00 % |
| HOMBRES | 12 | +460 | 4,181.82 % | +5 | 71.43 % |
| MUJERES | 18 | +1 | 5.88 % | 0 | 0 % |
| MAYORES DE 45 AÑOS | 33 | -1 | -2.94 % | 0 | 0 % |
| HOMBRES | 15 | -1 | -6.25 % | +1 | 7.14 % |
| MUJERES | 18 | 0 | 0 % | -1 | -5.26 % |
| SECTOR: | |||||
| AGRICULTURA | <5 | - | 0 % | - | 0 % |
| INDUSTRIA | 20 | +3 | 17.65 % | +8 | 66.67 % |
| CONSTRUCCIÓN | 0 | 0 | 0 % | 0 | 0 % |
| SERVICIOS | 36 | 0 | 0 % | -2 | -5.26 % |
| SIN EMPLEO ANTERIOR | 12 | 0 | 0 % | +1 | 9.09 % |

 |  |  |
(Ir al Índice)
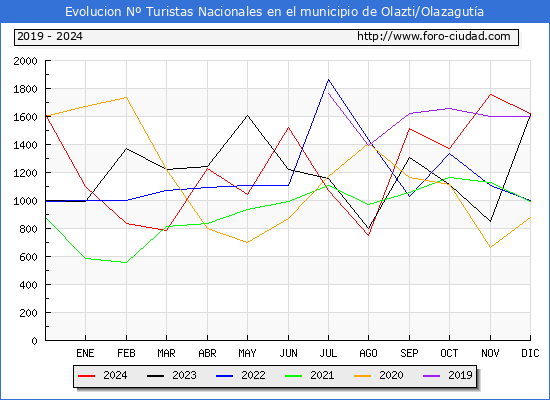
Los turistas de origen internacional ascendieron a 970 un -17,7% menos que en el mismo mes de 2023 y el nº de turistas nacionales fue de 1.625 un 0,7% más.
El nº total de turistas que han visitado Olazti/Olazagutía de Enero a Diciembre de 2024 ha sido de 25.227 un -3,1% menos que en el mismo periodo de 2023,el total de turistas de origen nacional ha sido de 14.612 (+0,8%) y los de origen internacional 10.615 (-8,0%).

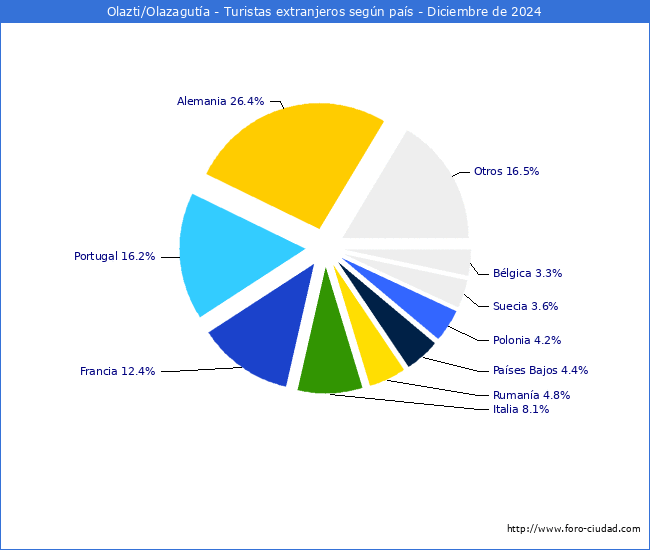
Estadisticas turísticas a Diciembre de 2024.
En Diciembre de 2024 el Nº de turistas que visitaron* Olazti/Olazagutía fue de 2.595 un -7,1% menos que en Diciembre de 2023.Los turistas de origen internacional ascendieron a 970 un -17,7% menos que en el mismo mes de 2023 y el nº de turistas nacionales fue de 1.625 un 0,7% más.
El nº total de turistas que han visitado Olazti/Olazagutía de Enero a Diciembre de 2024 ha sido de 25.227 un -3,1% menos que en el mismo periodo de 2023,el total de turistas de origen nacional ha sido de 14.612 (+0,8%) y los de origen internacional 10.615 (-8,0%).


| Estadísticas turísticas en otros municipios | |||
| Municipio | Total Turistas Diciembre 2024 | Diferencia Diciembre 2023 | Top |
| Pamplona/Iruña | 64.428 | +1.489 (2,4%) | 39 |
| Altsasu/Alsasua | 3.895 | -1.159 (-22,9%) | 746 |
| Lazkao | 846 | +174 (25,9%) | 2.705 |
| Ziordia | 1.226 | +710 (137,6%) | 2.084 |
| Urdiain | 893 | +446 (99,8%) | 2.622 |
*:Se consideran viajes turísticos todos los desplazamientos con destino principal fuera del lugar de residencia habitual de la persona, que implique una pernoctación fuera del mismo.
 |  |  |
(Ir al Índice)
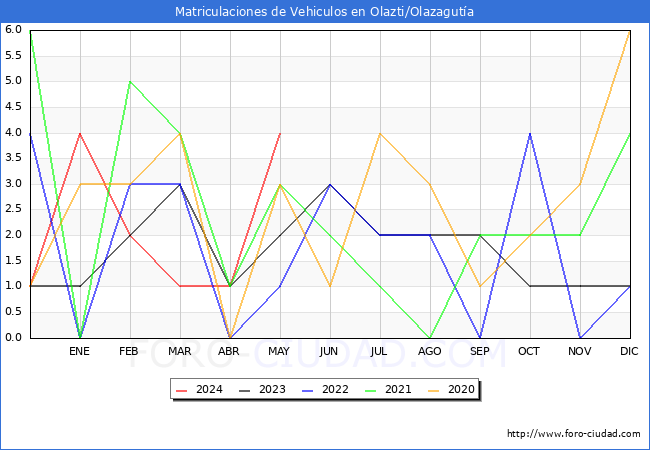
Matriculaciones vehículos en Mayo de 2024 .
| Matriculaciones | Mayo 2024 | Mayo 2023 | 12 Meses Interanual | 12 Meses Anteriores | ||||
| Mat | Dif | % | Mat | Dif | % | |||
| TOTAL | 4 | 2 | +2 | 100.00 % | 24 | 21 | +3 | 14.29 % |
| TURISMOS | 2 | 1 | +1 | 100.00 % | 11 | 13 | -2 | -15.38 % |
| CAMIONES | 0 | 0 | 0 | 0.00 % | 6 | 2 | +4 | 200.00 % |
| AUTOBUSES | 0 | 0 | 0 | 0.00 % | 0 | 0 | 0 | 0.00 % |
| CAMIONETAS | 0 | 0 | 0 | 0.00 % | 0 | 0 | 0 | 0.00 % |
| TRACTORES | 0 | 0 | 0 | 0.00 % | 0 | 0 | 0 | 0.00 % |
| MOTOCICLETAS | 0 | 0 | 0 | 0.00 % | 0 | 0 | 0 | 0.00 % |
| CICLOMOTORES | 0 | 0 | 0 | 0.00 % | 0 | 0 | 0 | 0.00 % |
| OTROS | 2 | 1 | +1 | 100.00 % | 7 | 6 | +1 | 16.67 % |
| Matriculaciones en otros municipios | ||
| Municipio | Matriculaciones Mayo 2024 | Diferencia Mayo 2023 |
| Pamplona/Iruña | 314 | +19 (6.44%) |
| Altsasu/Alsasua | 8 | 0 (0.00%) |
| Lazkao | 8 | 0 (0.00%) |
| Ziordia | 0 | 0 (0.00%) |
| Urdiain | 1 | +1 (100.00%) |

 |  |  |
Elaboracion:Foro-ciudad.com (Se puede usar todo el contenido, insertando link a esta pagina).
Fuentes:
Instituto Nacional de Estadística
1900-1981: Poblaciones de hecho desde 1900 hasta 1991. Cifras oficiales sacadas de los Censos respectivos.
1986-1995: Poblaciones de derecho desde 1986 hasta 1995. Cifras de las rectificaciones y renovaciones Padrónales.
1996-2024: Cifras Oficiales de Población de los Municipios Españoles:Revisión del Padrón Municipal.
Medición del turismo a partir de la posición de los teléfonos móviles.
Ministerio de Hacienda y Administraciones Públicas
Agencia Tributaria
Servicio Público de Empleo Estatal
Seguridad Social
Ministerio de Fomento
DGT
Catastro *Datos no disponibles para Navarra y Pais Vasco.


