Demografia de Molina de Segura
Esta información pretende ofrecer una visión actual de la información demográfica puesta a disposición por el INE a través de sus diferentes publicaciones estadísticas, sobre todo usando como fuente el Padrón Municipal que se actualiza anualmente.
Mapa edad edificaciones
Evolución población 1900 hasta 2024
Habitantes segun lugar de nacimiento
Pirámide de población
Crecimiento Natural o Vegetativo
Numero de Matrimonios
Residentes en el Extranjero
Estadística del IRPF
Precio Vivienda 3º Trimestre de 2024
Transacciones Inmobiliarias 3º Trimestre de 2024
Afiliados a la Seguridad Social a Febrero de 2025
Paro registrado a Febrero de 2025
Estadisticas Turismo a Diciembre de 2024
Matriculaciones vehículos en Mayo de 2024
Habitantes por Localidad
Habitantes en municipios cercanos
Habitantes provincia de Murcia 2024
(Ir al Índice)Evolución población 1900 hasta 2024
Habitantes segun lugar de nacimiento
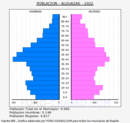
Pirámide de población
Crecimiento Natural o Vegetativo
Numero de Matrimonios
Residentes en el Extranjero
Estadística del IRPF
Precio Vivienda 3º Trimestre de 2024
Transacciones Inmobiliarias 3º Trimestre de 2024
Afiliados a la Seguridad Social a Febrero de 2025
Paro registrado a Febrero de 2025
Estadisticas Turismo a Diciembre de 2024
Matriculaciones vehículos en Mayo de 2024
Habitantes por Localidad
Habitantes en municipios cercanos
Habitantes provincia de Murcia 2024
Mapa edad edificaciones.
En el siguiente mapa se puede observar la edad de los edificios de Molina de Segura, los datos provienen del Catastro y están actualizados a Octubre de 2019 .
Cada color representa una década, excepto el Negro que representa todos los edificios anteriores a 1900,que suele ser el casco histórico, en el mapa puede apreciarse como ha sido el desarrollo urbanístico de Molina de Segura a lo largo del tiempo.
En la tabla posterior podemos ver la cantidad de superficie construida (en m2) por década,así como la posición que ocupa el municipio en un Top nacional y provincial para cada década.
En la tabla posterior podemos ver la cantidad de superficie construida (en m2) por década,así como la posición que ocupa el municipio en un Top nacional y provincial para cada década.
| Superficie Construida | ||||
| Decada | % Total | Top Provincial | Top Nacional* | |
| <1900 | 0.05% | <- 24º -> | <- 2791º -> | |
| 1900-1909 | 0.10% | <- 30º -> | <- 4213º -> | |
| 1910-1919 | 0.05% | <- 21º -> | <- 1594º -> | |
| 1920-1929 | 0.14% | <- 23º -> | <- 1763º -> | |
| 1930-1939 | 0.55% | <- 15º -> | <- 367º -> | |
| 1940-1949 | 0.71% | <- 14º -> | <- 399º -> | |
| 1950-1959 | 2.55% | <- 6º -> | <- 109º -> | |
| 1960-1969 | 4.66% | <- 6º -> | <- 162º -> | |
| 1970-1979 | 15.43% | <- 4º -> | <- 97º -> | |
| 1980-1989 | 11.84% | <- 5º -> | <- 100º -> | |
| 1990-1999 | 20.18% | <- 3º -> | <- 68º -> | |
| 2000-2009 | 38.81% | <- 3º -> | <- 41º -> | |
| 2010-2019 | 4.95% | <- 4º -> | <- 83º -> | |
| Mapa edificaciones en otros Municipios |
(Ir al Índice)
Evolución de la población desde 1900 hasta 2024.
Segun los datos publicados por el INE a 1 de Enero de 2024 el número de habitantes en Molina de Segura es de 77.493, 1.419 habitantes mas que el en el año 2023. En el grafico siguiente se puede ver cuantos habitantes tiene Molina de Segura a lo largo de los años.| Habitantes en otros municipios | ||
| Municipio | Habitantes | Diferencia (2023) |
| Murcia | 474.617 | +5.440 |
| Alcantarilla | 43.547 | +498 |
| Orihuela | 83.720 | +1.271 |
| Alguazas | 10.204 | -14 |
| Las Torres de Cotillas | 22.406 | +223 |
Actualmente la densidad de poblacion en Molina de Segura es de 457,54 habitantes por Km2. Abajo se puede ver un mapa del casco urbano con las densidad de poblacion por secciones censales, en este caso se usa habitantes por 1.000m2. Se ha dividido por 1000 por lo que si se quiere pasar a Km2 solo hay que multiplicar su valor por 1000.

 |  |  |
Tabla con la evolución del número de hombres ,mujeres y total a lo largo de los años.
| Evolución de la población desde 1900 hasta 2024 | |||
| Año | Hombres | Mujeres | Total |
| 2024 | 38.626 | 38.867 | 77.493 |
| 2023 | 37.879 | 38.195 | 76.074 |
| 2022 | 37.281 | 37.481 | 74.762 |
| 2021 | 36.682 | 36.816 | 73.498 |
| 2020 | 36.494 | 36.601 | 73.095 |
| 2019 | 35.862 | 36.028 | 71.890 |
| 2018 | 35.392 | 35.572 | 70.964 |
| 2017 | 35.035 | 35.309 | 70.344 |
| 2016 | 34.700 | 34.914 | 69.614 |
| 2015 | 34.617 | 34.714 | 69.331 |
| 2014 | 34.372 | 34.403 | 68.775 |
| 2013 | 34.292 | 34.158 | 68.450 |
| 2012 | 33.785 | 33.597 | 67.382 |
| 2011 | 33.540 | 33.235 | 66.775 |
| 2010 | 33.094 | 32.721 | 65.815 |
| 2009 | 32.194 | 31.871 | 64.065 |
| 2008 | 31.587 | 30.820 | 62.407 |
| 2007 | 29.984 | 29.381 | 59.365 |
| 2006 | 29.012 | 28.419 | 57.431 |
| 2005 | 27.541 | 27.132 | 54.673 |
| 2004 | 26.371 | 26.217 | 52.588 |
| 2003 | 25.350 | 25.195 | 50.545 |
| 2002 | 24.273 | 24.148 | 48.421 |
| 2001 | 23.140 | 23.112 | 46.252 |
| 2000 | 22.103 | 22.286 | 44.389 |
| 1999 | 21.401 | 21.695 | 43.096 |
| 1998 | 20.854 | 21.154 | 42.008 |
| 1995 | 20.498 | 21.021 | 41.519 |
| 1994 | 20.302 | 20.837 | 41.139 |
| 1993 | 19.814 | 20.396 | 40.210 |
| 1992 | 19.014 | 19.700 | 38.714 |
| 1991 | 18.595 | 19.211 | 37.806 |
| 1990 | 18.999 | 19.294 | 38.293 |
| 1989 | 18.474 | 18.815 | 37.289 |
| 1988 | 18.021 | 18.408 | 36.429 |
| 1987 | 17.527 | 17.875 | 35.402 |
| 1986 | 17.286 | 17.631 | 34.917 |
| 1981 | 0 | 0 | 31.322 |
| 1970 | 0 | 0 | 23.178 |
| 1960 | 0 | 0 | 16.308 |
| 1950 | 0 | 0 | 14.683 |
| 1940 | 0 | 0 | 13.721 |
| 1930 | 0 | 0 | 12.289 |
| 1920 | 0 | 0 | 10.991 |
| 1910 | 0 | 0 | 10.465 |
| 1900 | 0 | 0 | 8.615 |
(Ir al Índice)
Poblacion Máxima Estacional.
La población estacional máxima es una estimación de la población máxima que soporta Molina de Segura. En el cálculo se incluyen las personas que tienen algún tipo de vinculación o relación con el municipio, ya sea porque residen, trabajan, estudian o pasan algún período de tiempo en él. Los datos son publicados anualmente por el Ministerio de Hacienda y Administraciones Públicas, en colaboración con las Diputaciones Provinciales, Cabildos y Consejos Insulares.| Poblacion Estacional Máxima | |||
| Año | Personas | ||
| 2000 | 46.726 | ||
(Ir al Índice)
Habitantes segun lugar de nacimiento.
Según los datos publicados por el INE procedentes del padrón municipal de 2022 el 42.56% (31.816) de los habitantes empadronados en el Municipio de Molina de Segura han nacido en dicho municipio, el 40.81% han emigrado a Molina de Segura desde diferentes lugares de España, el 28.61% (21.390) desde otros municipios de la provincia de Murcia, el 12.20% (9.118) desde otras comunidades autónomas y el 16.64% (12.438) han emigrado a Molina de Segura desde otros países.
 |  |  |
| Estructura en otros Municipios |
En el siguiente gráfico podemos ver la evolución de la estructura de la población en el municipio de Molina de Segura si lo comparamos con 2021 vemos
- Disminuyen (-13) los habitantes nacidos en Molina de Segura, pasando del 43.31% al 42.56%.
- Aumentan (365) los habitantes nacidos en la provincia de Murcia, pasando del 28.61% al 28.61%.
- Aumentan (65) los habitantes nacidos en el resto de España, pasando del 12.32% al 12.20%.
- Aumentan (847) los habitantes nacidos en otros países, pasando del 15.77% al 16.64%.
- Aumentan (7.067) los habitantes nacidos en Molina de Segura, pasando del 60.20% al 42.56%.
- Aumentan (10.921) los habitantes nacidos en la provincia de Murcia, pasando del 25.47% al 28.61%.
- Aumentan (3.975) los habitantes nacidos en el resto de España, pasando del 12.51% al 12.20%.
- Aumentan (11.690) los habitantes nacidos en otros países, pasando del 1.82% al 16.64%.
 |  |  |
Segun los datos ofrecidos por el INE en la estadistica del Padrón los habitantes empadronados en Molina de Segura que han nacido en otros países ascienden a 12.438. 
- 5691 habitantes, 2522 hombres y 3169 mujeres nacidos en América.
- 3317 habitantes, 2017 hombres y 1300 mujeres nacidos en África.
- 329 habitantes, 157 hombres y 172 mujeres nacidos en Asia.
- 1 hombre nacido en Oceanía.


 |  |  |
| Habitantes segun Pais de Nacimiento | |||
| Pais | 2022 | Dif (2021) | |
| Bulgaria | 257 | 7 | |
| Francia | 552 | 9 | |
| Italia | 143 | 12 | |
| Polonia | 50 | 2 | |
| Portugal | 87 | 4 | |
| Reino Unido | 125 | -1 | |
| Alemania | 252 | -2 | |
| Rumanía | 962 | 24 | |
| Ucrania | 248 | 21 | |
| Rusia | 96 | 2 | |
| Argelia | 254 | 24 | |
| Marruecos | 2799 | 258 | |
| Nigeria | 29 | 1 | |
| Senegal | 101 | 9 | |
| Cuba | 295 | 32 | |
| República Dominicana | 123 | 8 | |
| Argentina | 351 | 62 | |
| Bolivia | 383 | 12 | |
| Brasil | 305 | 9 | |
| Colombia | 1405 | 105 | |
| Chile | 50 | 10 | |
| Ecuador | 1721 | 37 | |
| Paraguay | 84 | 3 | |
| Perú | 161 | 25 | |
| Uruguay | 105 | 23 | |
| Venezuela | 296 | 32 | |
| China | 237 | 15 | |
| Pakistán | 35 | 11 | |
| Otros | 932 | 93 | |

 |  |  |
Teniendo en cuenta la proporción de habitantes nacidos en otro pais sobre la población total del municipio, hemos realizado un ranking, en el que la 1ª posición esta ocupada por el municipio con una proporción mayor de habitantes nacidos en otro pais, aquí puede verse en que lugar esta el municipio de Molina de Segura y sus municipios cercanos.
| Top Municipal % Habitantes nacidos en otro pais | |||
| Provincia | Municipio | Pos | % |
| Lleida | Tremp | 564 | 21,57 |
| Murcia | Alguazas | 765 | 19,08 |
| Murcia | Lorquí | 945 | 17,71 |
| Lleida | Térmens | 1.124 | 16,65 |
| Murcia | Molina de Segura | 1.125 | 16,64 |
| Barcelona | Sant Pol de Mar | 1.126 | 16,62 |
| Murcia | Murcia | 1.476 | 14,82 |
| Murcia | Ceutí | 1.485 | 14,79 |
| Murcia | Alcantarilla | 1.837 | 13,29 |
| Murcia | Las Torres de Cotillas | 2.834 | 10,06 |
 |  |  |
| Pirámide en otros Municipios |
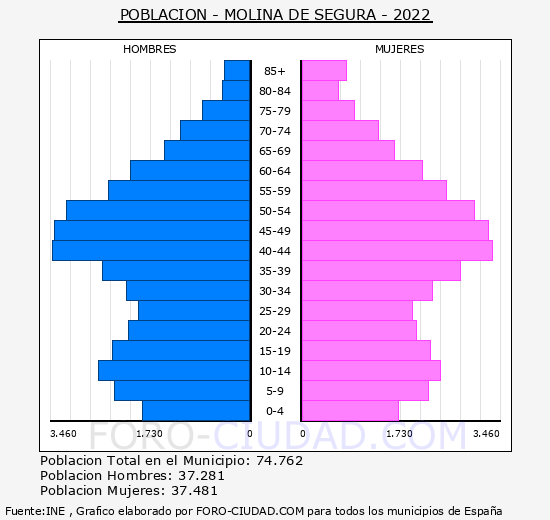
La media de edad de los habitantes de Molina de Segura es de 39,24 años, 1,49 años mas que hace un lustro que era de 37,75 años.
En el siguiente mapa de Molina de Segura se puede ver la edad media de los habitantes del municipio por secciones censales según los datos de 2019.

 |  |  |
| Población de Molina de Segura por sexo y edad 2022 (grupos quinquenales) | |||
| Edad | Hombres | Mujeres | Total |
| 0-5 | 1.876 | 1.725 | 3.601 |
| 5-10 | 2.369 | 2.233 | 4.602 |
| 10-15 | 2.661 | 2.454 | 5.115 |
| 15-20 | 2.398 | 2.256 | 4.654 |
| 20-25 | 2.121 | 2.021 | 4.142 |
| 25-30 | 1.955 | 1.955 | 3.910 |
| 30-35 | 2.160 | 2.298 | 4.458 |
| 35-40 | 2.575 | 2.800 | 5.375 |
| 40-45 | 3.458 | 3.326 | 6.784 |
| 45-50 | 3.409 | 3.279 | 6.688 |
| 50-55 | 3.199 | 3.016 | 6.215 |
| 55-60 | 2.488 | 2.534 | 5.022 |
| 60-65 | 2.084 | 2.119 | 4.203 |
| 65-70 | 1.507 | 1.630 | 3.137 |
| 70-75 | 1.213 | 1.377 | 2.590 |
| 75-80 | 836 | 954 | 1.790 |
| 80-85 | 495 | 686 | 1.181 |
| 85- | 477 | 818 | 1.295 |
| Total | 37.281 | 37.481 | 74.762 |
La poblacion menor de 18 años en Molina de Segura es de 16.190 (8.387 H, 7.803 M ), el 21,7%.
La poblacion entre 18 y 65 años en Molina de Segura es de 49.272 (24.681 H, 24.591 M ), el 65,9%.
La poblacion mayor de 65 años en Molina de Segura es de 9.300 (4.213 H, 5.087 M ), el 12,4%.
 |  |  |
(Ir al Índice)
Crecimiento Natural o Vegetativo.
El crecimiento natural de la población en el municipio de Molina de Segura, según los últimos datos publicados por el INE para el año 2022 ha sido Positivo, con 151 nacimientos mas que defunciones.  |  |  |
Tabla con la evolución del número de nacimientos , defunciones y crecimiento vegetativo.
| Evolución Nacimientos y Defunciones desde 1996 hasta 2022 | |||
| Año | Nacimientos | Fallecidos | Diferencia |
| 2022 | 620 | 469 | 151 |
| 2021 | 613 | 459 | 154 |
| 2020 | 628 | 417 | 211 |
| 2019 | 710 | 454 | 256 |
| 2018 | 730 | 359 | 371 |
| 2017 | 724 | 385 | 339 |
| 2016 | 762 | 401 | 361 |
| 2015 | 796 | 353 | 443 |
| 2014 | 834 | 364 | 470 |
| 2013 | 862 | 349 | 513 |
| 2012 | 880 | 302 | 578 |
| 2011 | 889 | 316 | 573 |
| 2010 | 913 | 367 | 546 |
| 2009 | 888 | 344 | 544 |
| 2008 | 1.015 | 316 | 699 |
| 2007 | 896 | 334 | 562 |
| 2006 | 818 | 316 | 502 |
| 2005 | 800 | 272 | 528 |
| 2004 | 710 | 298 | 412 |
| 2003 | 707 | 275 | 432 |
| 2002 | 648 | 269 | 379 |
| 2001 | 609 | 299 | 310 |
| 2000 | 537 | 283 | 254 |
| 1999 | 489 | 278 | 211 |
| 1998 | 515 | 251 | 264 |
| 1997 | 482 | 244 | 238 |
| 1996 | 475 | 236 | 239 |
(Ir al Índice)
Evolución número de Matrimonios.
En el siguiente grafico y tabla podemos ver la evolución en el número de matrimonios que se han otorgado en el Municipio de Molina de Segura hasta el año 2022.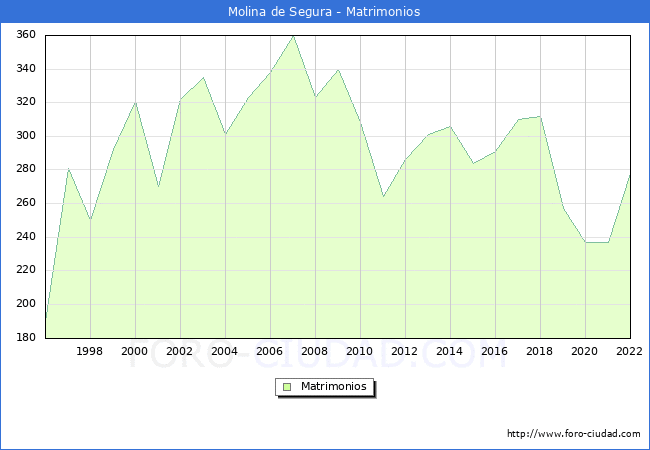
 |  |  |
| Evolución Matrimonios desde 1996 hasta 2022 | |
| Año | Matrimonios |
| 2022 | 278 |
| 2021 | 237 |
| 2020 | 178 |
| 2019 | 257 |
| 2018 | 312 |
| 2017 | 310 |
| 2016 | 291 |
| 2015 | 284 |
| 2014 | 306 |
| 2013 | 301 |
| 2012 | 286 |
| 2011 | 264 |
| 2010 | 308 |
| 2009 | 340 |
| 2008 | 323 |
| 2007 | 360 |
| 2006 | 338 |
| 2005 | 323 |
| 2004 | 301 |
| 2003 | 335 |
| 2002 | 322 |
| 2001 | 270 |
| 2000 | 321 |
| 1999 | 292 |
| 1998 | 250 |
| 1997 | 281 |
| 1996 | 190 |
(Ir al Índice)
Residentes en el extranjero.
Segun los datos publicados por el INE en el CERA, Censo Electoral de españoles residentes en el extranjero a 1 de Noviembre de 2024 los los españoles que residen habitualmente en el extranjero o han trasladado al extranjero su residencia habitual mayores de 18 años eran 1105 personas con municipio de origen en Molina de Segura.
 |  |  |
(Ir al Índice)
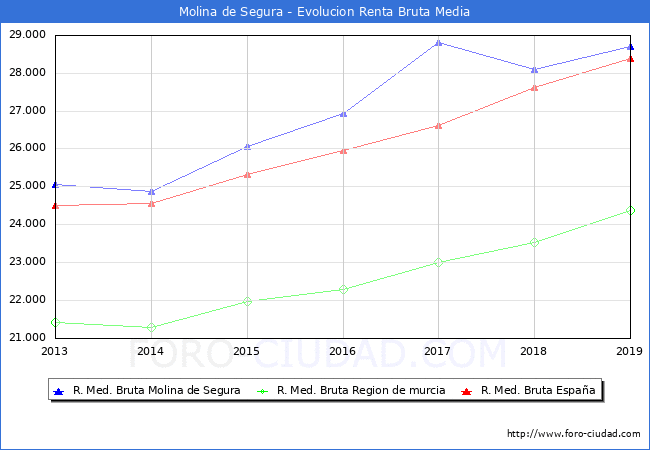
En 2019 Molina de Segura se sitúa como el municipio nº2 con una mayor renta bruta media en la comunidad de Region de murcia y el nº584 a nivel Nacional (sin PV y Navarra), abajo se muestra una tabla con las posiciones en las que se encuentran los municipios cercanos y con población parecida.
Los habitantes de Molina de Segura liquidaron 135.285.998€ en concepto de IRPF en el año 2019 y recibieron por parte de las diferentes administraciones de forma directa en el presupuesto municipal (capitulo 4 Y 7) 19.989.028€ un 14,78% de lo aportado, en la siguiente tabla podemos ver las cifras de los municipios cercanos o de población similar.

Estadística del IRPF
Segun los datos hechos publicos por el Ministerio de Hacienda la renta bruta media por declarante, en el municipio de Molina de Segura en 2019 fue de 28.703€, 612€ mas que en el año 2018 . Una vez descontada la liquidacion por IRPF y lo aportado a la Seguridad Social la renta disponible media por declarante se situó en 23.281€, 436€ mas que en el año 2018.  |  |  |
| Evolución de la Renta Media en Molina de Segura | ||||
| Año | Renta Bruta | Var | Renta Dispo | Var |
| 2019 | 28.703€ | 612€ (2,13%) | 23.281€ | 436€ (1,87%) |
| 2018 | 28.091€ | -722€ (-2,57%) | 22.845€ | -498€ (-2,18%) |
| 2017 | 28.813€ | 1.865€ (6,47%) | 23.343€ | 1.365€ (5,85%) |
| 2016 | 26.948€ | 881€ (3,27%) | 21.978€ | 629€ (2,86%) |
| 2015 | 26.067€ | 1.186€ (4,55%) | 21.349€ | 1.178€ (5,52%) |
| 2014 | 24.881€ | -173€ (-0,70%) | 20.171€ | -177€ (-0,88%) |
| 2013 | 25.054€ | 0€ (0,00%) | 20.348€ | 0€ (0,00%) |
En 2019 Molina de Segura se sitúa como el municipio nº2 con una mayor renta bruta media en la comunidad de Region de murcia y el nº584 a nivel Nacional (sin PV y Navarra), abajo se muestra una tabla con las posiciones en las que se encuentran los municipios cercanos y con población parecida.
| Renta Municipios Cercanos | ||||
| Municipio | Renta Bruta | Pos Prov | Pos Comu | Pos Naci |
| Arcos (Burgos) | 28.706€ | 13 | 39 | 583 |
| Molina de Segura (Murcia) | 28.703€ | 2 | 2 | 584 |
| Vallbona d'Anoia (Barcelona) | 28.701€ | 187 | 352 | 585 |
| Murcia (Murcia) | 28.238€ | 3 | 3 | 639 |
| Las Torres de Cotillas (Murcia) | 23.600€ | 6 | 6 | 1645 |
| Alcantarilla (Murcia) | 23.038€ | 7 | 7 | 1839 |
| Orihuela (Alicante) | 21.482€ | 49 | 218 | 2398 |
| Alguazas (Murcia) | 20.471€ | 23 | 23 | 2825 |
Los habitantes de Molina de Segura liquidaron 135.285.998€ en concepto de IRPF en el año 2019 y recibieron por parte de las diferentes administraciones de forma directa en el presupuesto municipal (capitulo 4 Y 7) 19.989.028€ un 14,78% de lo aportado, en la siguiente tabla podemos ver las cifras de los municipios cercanos o de población similar.
| Liquidación IPRF vs Presupuesto Ayuntamiento | |||
| Municipio | Liquidación | Capitulo 4 y 7 Presupuesto | % |
| Arcos (Burgos) | 3.585.975€ | 512.182€ | 14,28 % |
| Molina de Segura (Murcia) | 135.285.998€ | 19.989.028€ | 14,78 % |
| Vallbona d'Anoia (Barcelona) | 2.602.794€ | 871.902€ | 33,50 % |
| Murcia (Murcia) | 812.882.686€ | 109.025.508€ | 13,41 % |
| Las Torres de Cotillas (Murcia) | 24.473.128€ | 6.894.704€ | 28,17 % |
| Alcantarilla (Murcia) | 40.710.669€ | 12.011.364€ | 29,50 % |
| Orihuela (Alicante) | 82.951.747€ | 42.298.075€ | 50,99 % |
| Alguazas (Murcia) | 6.668.388€ | 2.506.422€ | 37,59 % |
Indicadores de desigualdad.
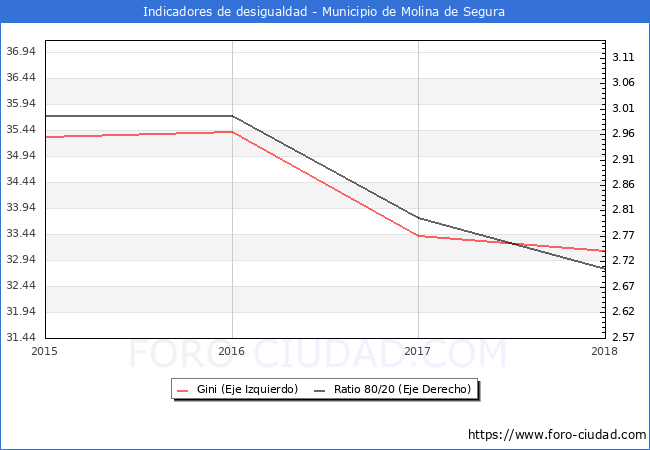
Íntimamente ligado a la pobreza se halla el concepto de desigualdad. Para entender mejor cómo afecta a la distribución de la renta en Molina de Segura, mostramos los valores de dos de los indicadores habituales encargados de reflejarla, el ratio 80/20 y el Índice de Gini.
En el año 2018 el Indice de Gini para Molina de Segura era de 33.10 y el ratio 80/20 era de 2.70.

Ratio 80/20 Cociente entre los ingresos totales del 20% de las personas con ingresos más elevados (percentil 80) y los ingresos totales del 20% de la población con menos ingresos (percentil 20).
El índice de Gini, es utilizado para analizar el grado de inequidad en la distribución respecto a los ingresos. Este indicador toma valores entre cero y uno (o entre 0 y 100 si se da en porcentaje); 0 cuando todas las personas tengan los mismos ingresos (perfecta igualdad), y 1 si todo el ingreso nacional está en manos de una única persona (perfecta desigualdad).
El índice de Gini, es utilizado para analizar el grado de inequidad en la distribución respecto a los ingresos. Este indicador toma valores entre cero y uno (o entre 0 y 100 si se da en porcentaje); 0 cuando todas las personas tengan los mismos ingresos (perfecta igualdad), y 1 si todo el ingreso nacional está en manos de una única persona (perfecta desigualdad).
| Indicadores en otros municipios | ||
| Municipio | Gini | Ratio 80/20 |
| Murcia | 34.30 | 3.00 |
| Alcantarilla | 31.80 | 2.70 |
| Orihuela | 35.00 | 3.00 |
| Alguazas | 30.40 | 2.80 |
| Las Torres de Cotillas | 29.20 | 2.30 |
En el siguiente mapa de Molina de Segura se puede ver la renta per capita de los habitantes del municipio por secciones censales con los datos del año 2018.

 |  |  |
(Ir al Índice)
Precio Vivienda 3ºT 2024
Segun los datos hechos publicos por el Ministerio de Fomento, para los municipios de mas de 25.000 habitantes, el precio de la vivienda en Molina de Segura durante el 3º trimestre de 2024 , fue de 989 €/m2, un -2,2% menos que en el trimestre anterior , y un 47,3% menos desde el maximo alcanzado en el 3º trimestre de 2008 (1.875 €/m2).
 |  |  |
| Precio de la vivienda en otros Municipios |
(Ir al Índice)
El nº total de Transacciones de vivienda hasta el 3º Trimestre de 2024 ha sido de 749 un 10.96% mas que en el mismo periodo de 2023 (675).
A continuación se muestra la evolución de los últimos años de forma grafica:
Transacciones Inmobiliarias 3ºT 2024
Segun los datos del 3º Trimestre del 2024 publicados por el Ministerio de Vivienda, el nº de transacciones inmobiliarias en el municipio de Molina de Segura asciende a un total de 239, el 8.14% mas que en el 3T de 2023,de las cuales 8 son transacciones de viviendas nuevas y 231 de segunda mano.El nº total de Transacciones de vivienda hasta el 3º Trimestre de 2024 ha sido de 749 un 10.96% mas que en el mismo periodo de 2023 (675).
A continuación se muestra la evolución de los últimos años de forma grafica:

 |  |  |
(Ir al Índice)


Este grafico no es una imagen fiel de la población en edad de trabajar del municipio, debido a que la Seguridad Social, publica los Afiliados por municipio teniendo en cuenta el centro de trabajo y no la residencia del trabajador, por tanto en los municipios como capitales administrativas o municipios dormitorio los datos se alejaran de la realidad por el movimiento de trabajadores entre municipios.
Afiliados a la Seguridad Social a Febrero de 2025 .
| Febrero 2025 | Total Afiliados | Variacion | |||
| Mensual | Anual | ||||
| Absoluta | Relativa | Absoluta | Relativa | ||
| Total | 31589 | -9 | -0.03 % | +105 | 0.33 % |
| REGIMEN: | |||||
| GENERAL | 24831 | -213 | -0.85 % | +39 | 0.16 % |
| AUTONOMOS | 5181 | +26 | 0.50 % | +70 | 1.37 % |
| AGRARIO | 1006 | +179 | 21.64 % | +24 | 2.44 % |
| HOGAR | 570 | -1 | -0.18 % | -28 | -4.68 % |
| MAR | <5 | - | 0 % | - | 0 % |
| CARBON | 0 | 0 | 0 % | 0 | 0 % |

| Afiliación en otros municipios | ||
| Municipio | Afiliados | Dif. Mes Ant. |
| Murcia | 249.724 | 1.770 |
| Alcantarilla | 17.294 | 133 |
| Orihuela | 27.127 | 295 |
| Alguazas | 2.180 | 25 |
| Las Torres de Cotillas | 9.225 | 41 |

 |  |  |
(Ir al Índice)
El número total de parados es de 4102, de los cuales 1508 son hombres y 2594 mujeres.
Las personas mayores de 45 años con 2262 parados son el grupo de edad mas afectado por el paro, seguido de los que se encuentran entre 25 y 44 años con 1414 parados, el grupo menos numeroso son los menores de 25 años con 426 parados.
Por sectores vemos que en el sector servicios es donde mayor número de parados existe en el municipio con 2726 personas, seguido de la industria con 523 parados, las personas sin empleo anterior con 514 parados, la construcción con 231 parados y por ultimo la agricultura con 108 parados.
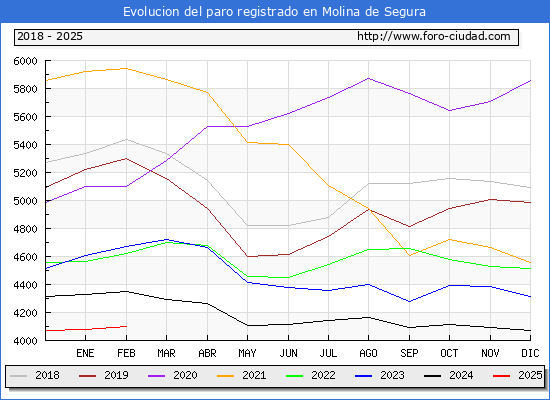
Paro registrado a Febrero de 2025.
Segun los datos publicados por el SEPE en el mes de Febrero el número de parados ha subido en 26 personas. De las 26 personas nuevas en de la lista del paro en Molina de Segura aumento en 21 hombres y 5 mujeres.El número total de parados es de 4102, de los cuales 1508 son hombres y 2594 mujeres.
Las personas mayores de 45 años con 2262 parados son el grupo de edad mas afectado por el paro, seguido de los que se encuentran entre 25 y 44 años con 1414 parados, el grupo menos numeroso son los menores de 25 años con 426 parados.
Por sectores vemos que en el sector servicios es donde mayor número de parados existe en el municipio con 2726 personas, seguido de la industria con 523 parados, las personas sin empleo anterior con 514 parados, la construcción con 231 parados y por ultimo la agricultura con 108 parados.
| Febrero 2025 | Total Parados | Variacion | |||
| Mensual | Anual | ||||
| Absoluta | Relativa | Absoluta | Relativa | ||
| Total | 4102 | +26 | 0.64 % | -245 | -5.64 % |
| HOMBRES | 1508 | +21 | 1.41 % | -63 | -4.01 % |
| MUJERES | 2594 | +5 | 0.19 % | -182 | -6.56 % |
| MENORES DE 25 AÑOS: | 426 | +38 | 9.79 % | +9 | 2.16 % |
| HOMBRES | 224 | +30 | 15.46 % | +9 | 4.19 % |
| MUJERES | 202 | +8 | 4.12 % | 0 | 0 % |
| ENTRE 25 Y 44 AÑOS | 1414 | -4 | -0.28 % | -90 | -5.98 % |
| HOMBRES | 531 | +24304 | 4,611.76 % | -13 | -2.39 % |
| MUJERES | 883 | -8 | -0.90 % | -77 | -8.02 % |
| MAYORES DE 45 AÑOS | 2262 | -8 | -0.35 % | -164 | -6.76 % |
| HOMBRES | 753 | -13 | -1.70 % | -59 | -7.27 % |
| MUJERES | 1509 | +5 | 0.33 % | -105 | -6.51 % |
| SECTOR: | |||||
| AGRICULTURA | 108 | -7 | -6.09 % | -10 | -8.47 % |
| INDUSTRIA | 523 | +11 | 2.15 % | -73 | -12.25 % |
| CONSTRUCCIÓN | 231 | -5 | -2.12 % | -52 | -18.37 % |
| SERVICIOS | 2726 | +2 | 0.07 % | -114 | -4.01 % |
| SIN EMPLEO ANTERIOR | 514 | +25 | 5.11 % | +4 | 0.78 % |

 |  |  |
(Ir al Índice)
Los turistas de origen internacional ascendieron a 3.582 un 31,0% más que en el mismo mes de 2023 y el nº de turistas nacionales fue de 8.276 un 15,7% más.
El nº total de turistas que han visitado Molina de Segura de Enero a Diciembre de 2024 ha sido de 123.592 un 14,9% más que en el mismo periodo de 2023,el total de turistas de origen nacional ha sido de 84.952 (+9,9%) y los de origen internacional 38.640 (+27,5%).
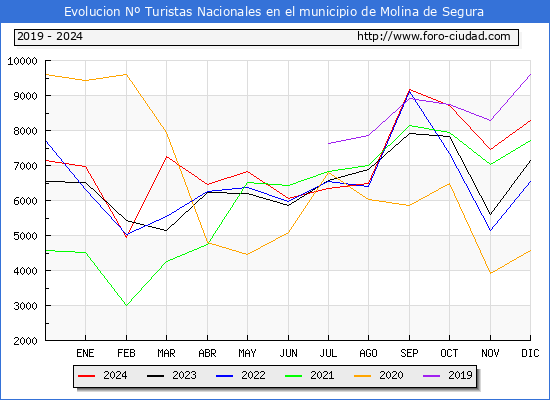

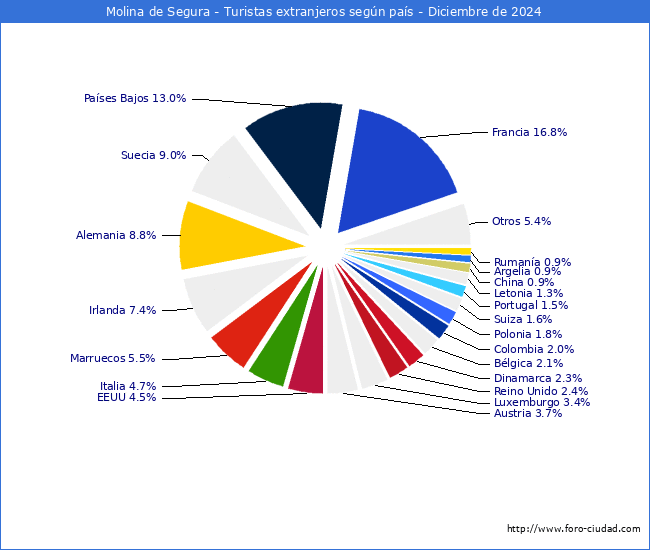
Estadisticas turísticas a Diciembre de 2024.
En Diciembre de 2024 el Nº de turistas que visitaron* Molina de Segura fue de 11.858 un 20,0% más que en Diciembre de 2023.Los turistas de origen internacional ascendieron a 3.582 un 31,0% más que en el mismo mes de 2023 y el nº de turistas nacionales fue de 8.276 un 15,7% más.
El nº total de turistas que han visitado Molina de Segura de Enero a Diciembre de 2024 ha sido de 123.592 un 14,9% más que en el mismo periodo de 2023,el total de turistas de origen nacional ha sido de 84.952 (+9,9%) y los de origen internacional 38.640 (+27,5%).


| Estadísticas turísticas en otros municipios | |||
| Municipio | Total Turistas Diciembre 2024 | Diferencia Diciembre 2023 | Top |
| Murcia | 98.334 | 401 (0,4%) | 22 |
| Alcantarilla | 3.876 | +1.007 (35,1%) | 749 |
| Orihuela | 58.316 | +5.983 (11,4%) | 48 |
| Alguazas | 740 | +152 (25,9%) | 2.932 |
| Las Torres de Cotillas | 3.033 | +820 (37,1%) | 937 |
*:Se consideran viajes turísticos todos los desplazamientos con destino principal fuera del lugar de residencia habitual de la persona, que implique una pernoctación fuera del mismo.
 |  |  |
(Ir al Índice)
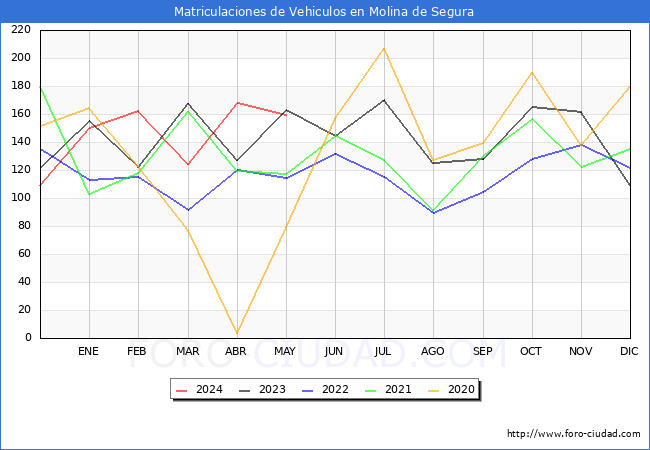
Matriculaciones vehículos en Mayo de 2024 .
| Matriculaciones | Mayo 2024 | Mayo 2023 | 12 Meses Interanual | 12 Meses Anteriores | ||||
| Mat | Dif | % | Mat | Dif | % | |||
| TOTAL | 159 | 163 | -4 | -2.45 % | 1765 | 1561 | +204 | 13.07 % |
| TURISMOS | 95 | 86 | +9 | 10.47 % | 1100 | 952 | +148 | 15.55 % |
| CAMIONES | 18 | 20 | -2 | -10.00 % | 216 | 182 | +34 | 18.68 % |
| AUTOBUSES | 0 | 1 | -1 | -100.00 % | 1 | 3 | -2 | -66.67 % |
| CAMIONETAS | 7 | 11 | -4 | -36.36 % | 71 | 53 | +18 | 33.96 % |
| TRACTORES | 1 | 2 | -1 | -50.00 % | 11 | 19 | -8 | -42.11 % |
| MOTOCICLETAS | 31 | 33 | -2 | -6.06 % | 267 | 267 | 0 | 0.00 % |
| CICLOMOTORES | 1 | 1 | 0 | 0.00 % | 26 | 22 | +4 | 18.18 % |
| OTROS | 6 | 9 | -3 | -33.33 % | 73 | 63 | +10 | 15.87 % |
| Matriculaciones en otros municipios | ||
| Municipio | Matriculaciones Mayo 2024 | Diferencia Mayo 2023 |
| Murcia | 1.071 | +80 (8.07%) |
| Alcantarilla | 71 | +9 (14.52%) |
| Orihuela | 356 | -45 (-11.22%) |
| Alguazas | 17 | +4 (30.77%) |
| Las Torres de Cotillas | 42 | -45 (-51.72%) |

 |  |  |
(Ir al Índice)
Habitantes en localidades del Municipio.
- Albarda (2000-2023)
- Altorreal (2000-2023)
- Campotéjar Alta (2000-2023)
- Campotéjar Baja (2000-2023)
- Casa del Cura (2000-2023)
- Casa Ros (2000-2023)
- Comala (2000-2023)
- El Llano (2000-2023)
- El Pino (2000-2023)
- Estación de Archena (2000-2023)
- Fenazar (2000-2023)
- Finca de Maximino (2000-2023)
- La Alcaina (2000-2023)
- La Espada (2000-2023)
- La Hornera (2000-2023)
- La Hurona (2000-2023)
- La Quinta-Tierra Cálida (2010-2023)
- Los Conejos (2000-2023)
- Los Olivos (2000-2023)
- Los Valientes (2000-2023)
- Los Vientos (2000-2023)
- Mirador de Agridulce II (2010-2023)
- Monteprincipe (2000-2023)
- Rellano (2000-2023)
- Ribera de Arriba (2000-2023)
- Ribera de Molina (2000-2023)
- Romeral (2000-2023)
- Romeral Ii (2000-2023)
- Torrealta (2000-2023)
- Toscas-Chorrico (2000-2023)
Elaboracion:Foro-ciudad.com (Se puede usar todo el contenido, insertando link a esta pagina).
Fuentes:
Instituto Nacional de Estadística
1900-1981: Poblaciones de hecho desde 1900 hasta 1991. Cifras oficiales sacadas de los Censos respectivos.
1986-1995: Poblaciones de derecho desde 1986 hasta 1995. Cifras de las rectificaciones y renovaciones Padrónales.
1996-2024: Cifras Oficiales de Población de los Municipios Españoles:Revisión del Padrón Municipal.
Medición del turismo a partir de la posición de los teléfonos móviles.
Ministerio de Hacienda y Administraciones Públicas
Agencia Tributaria
Servicio Público de Empleo Estatal
Seguridad Social
Ministerio de Fomento
DGT
Catastro *Datos no disponibles para Navarra y Pais Vasco.


