Demografia de Ceuta
Esta información pretende ofrecer una visión actual de la información demográfica puesta a disposición por el INE a través de sus diferentes publicaciones estadísticas, sobre todo usando como fuente el Padrón Municipal que se actualiza anualmente.
Mapa edad edificaciones
Evolución población 1930 hasta 2024
Habitantes segun lugar de nacimiento
Pirámide de población
Crecimiento Natural o Vegetativo
Numero de Matrimonios
Residentes en el Extranjero
Estadística del IRPF
Precio Vivienda 3º Trimestre de 2024
Transacciones Inmobiliarias 3º Trimestre de 2024
Afiliados a la Seguridad Social a Agosto de 2025
Paro registrado a Agosto de 2025
Estadisticas Turismo a Diciembre de 2024
Matriculaciones vehículos en Mayo de 2024
Habitantes por Localidad
Habitantes en municipios cercanos
Habitantes provincia de Ceuta 2024
(Ir al Índice)Evolución población 1930 hasta 2024
Habitantes segun lugar de nacimiento
Pirámide de población
Crecimiento Natural o Vegetativo
Numero de Matrimonios
Residentes en el Extranjero
Estadística del IRPF
Precio Vivienda 3º Trimestre de 2024
Transacciones Inmobiliarias 3º Trimestre de 2024
Afiliados a la Seguridad Social a Agosto de 2025
Paro registrado a Agosto de 2025
Estadisticas Turismo a Diciembre de 2024
Matriculaciones vehículos en Mayo de 2024
Habitantes por Localidad
Habitantes en municipios cercanos
Habitantes provincia de Ceuta 2024
Mapa edad edificaciones.
En el siguiente mapa se puede observar la edad de los edificios de Ceuta, los datos provienen del Catastro y están actualizados a Octubre de 2019 .
Cada color representa una década, excepto el Negro que representa todos los edificios anteriores a 1900,que suele ser el casco histórico, en el mapa puede apreciarse como ha sido el desarrollo urbanístico de Ceuta a lo largo del tiempo.
En la tabla posterior podemos ver la cantidad de superficie construida (en m2) por década,así como la posición que ocupa el municipio en un Top nacional y provincial para cada década.
En la tabla posterior podemos ver la cantidad de superficie construida (en m2) por década,así como la posición que ocupa el municipio en un Top nacional y provincial para cada década.
| Superficie Construida | ||||
| Decada | % Total | Top Provincial | Top Nacional* | |
| <1900 | 0.29% | 1º | <- 1854º -> | |
| 1900-1909 | 0.64% | 1º | <- 1970º -> | |
| 1910-1919 | 0.21% | 1º | <- 831º -> | |
| 1920-1929 | 1.50% | 1º | <- 220º -> | |
| 1930-1939 | 1.46% | 1º | <- 238º -> | |
| 1940-1949 | 2.83% | 1º | <- 137º -> | |
| 1950-1959 | 7.24% | 1º | <- 70º -> | |
| 1960-1969 | 14.28% | 1º | <- 96º -> | |
| 1970-1979 | 14.21% | 1º | <- 206º -> | |
| 1980-1989 | 12.69% | 1º | <- 210º -> | |
| 1990-1999 | 15.40% | 1º | <- 199º -> | |
| 2000-2009 | 21.65% | 1º | <- 239º -> | |
| 2010-2019 | 7.60% | 1º | <- 100º -> | |
| Mapa edificaciones en otros Municipios |
(Ir al Índice)
Evolución de la población desde 1930 hasta 2024.
Segun los datos publicados por el INE a 1 de Enero de 2024 el número de habitantes en Ceuta es de 83.229, 190 habitantes mas que el en el año 2023. En el grafico siguiente se puede ver cuantos habitantes tiene Ceuta a lo largo de los años.| Habitantes en otros municipios | ||
| Municipio | Habitantes | Diferencia (2023) |
| Melilla | 85.491 | +321 |
| Cádiz | 110.914 | -897 |
| Algeciras | 124.978 | +1.339 |
| La Línea de la Concepción | 64.177 | +404 |
| Sevilla | 687.488 | +3.463 |
Actualmente la densidad de poblacion en Ceuta es de 4.188,68 habitantes por Km2. Abajo se puede ver un mapa del casco urbano con las densidad de poblacion por secciones censales, en este caso se usa habitantes por 1.000m2. Se ha dividido por 1000 por lo que si se quiere pasar a Km2 solo hay que multiplicar su valor por 1000.

 |  |  |
Tabla con la evolución del número de hombres ,mujeres y total a lo largo de los años.
| Evolución de la población desde 1930 hasta 2024 | |||
| Año | Hombres | Mujeres | Total |
| 2024 | 41.980 | 41.249 | 83.229 |
| 2023 | 41.894 | 41.145 | 83.039 |
| 2022 | 41.927 | 41.190 | 83.117 |
| 2021 | 42.208 | 41.309 | 83.517 |
| 2020 | 42.542 | 41.660 | 84.202 |
| 2019 | 42.912 | 41.865 | 84.777 |
| 2018 | 43.177 | 41.967 | 85.144 |
| 2017 | 43.034 | 41.925 | 84.959 |
| 2016 | 42.846 | 41.673 | 84.519 |
| 2015 | 42.757 | 41.506 | 84.263 |
| 2014 | 43.354 | 41.609 | 84.963 |
| 2013 | 43.060 | 41.120 | 84.180 |
| 2012 | 42.948 | 41.070 | 84.018 |
| 2011 | 42.165 | 40.211 | 82.376 |
| 2010 | 41.269 | 39.310 | 80.579 |
| 2009 | 40.118 | 38.556 | 78.674 |
| 2008 | 39.385 | 38.004 | 77.389 |
| 2007 | 38.913 | 37.690 | 76.603 |
| 2006 | 38.581 | 37.280 | 75.861 |
| 2005 | 38.315 | 36.961 | 75.276 |
| 2004 | 38.113 | 36.541 | 74.654 |
| 2003 | 38.395 | 36.536 | 74.931 |
| 2002 | 39.195 | 36.957 | 76.152 |
| 2001 | 38.880 | 36.814 | 75.694 |
| 2000 | 38.497 | 36.744 | 75.241 |
| 1999 | 37.115 | 36.591 | 73.706 |
| 1998 | 36.103 | 36.015 | 72.118 |
| 1996 | 34.226 | 34.568 | 68.794 |
| 1995 | 36.486 | 36.656 | 73.142 |
| 1994 | 35.705 | 36.221 | 71.926 |
| 1993 | 35.024 | 35.753 | 70.777 |
| 1992 | 33.583 | 34.760 | 68.343 |
| 1991 | 33.193 | 34.422 | 67.615 |
| 1990 | 34.136 | 34.834 | 68.970 |
| 1989 | 33.568 | 34.446 | 68.014 |
| 1988 | 33.132 | 34.056 | 67.188 |
| 1987 | 26.493 | 26.746 | 53.239 |
| 1986 | 32.010 | 33.141 | 65.151 |
| 1981 | 0 | 0 | 70.864 |
| 1970 | 0 | 0 | 67.187 |
| 1960 | 0 | 0 | 73.182 |
| 1950 | 0 | 0 | 59.936 |
| 1940 | 0 | 0 | 59.115 |
| 1930 | 0 | 0 | 50.614 |
(Ir al Índice)
Habitantes segun lugar de nacimiento.
Según los datos publicados por el INE procedentes del padrón municipal de 2022 el 69.16% (57.480) de los habitantes empadronados en el Municipio de Ceuta han nacido en dicho municipio, el 18.22% han emigrado a Ceuta desde diferentes lugares de España, el 0.51% (423) desde otras provincias de la comunidad de Ceuta, el 17.71% (14.722) desde otras comunidades autónomas y el 12.62% (10.492) han emigrado a Ceuta desde otros países.
 |  |  |
| Estructura en otros Municipios |
En el siguiente gráfico podemos ver la evolución de la estructura de la población en el municipio de Ceuta si lo comparamos con 2021 vemos
- Aumentan (36) los habitantes nacidos en Ceuta, pasando del 68.78% al 69.16%.
- Disminuyen (-6) los habitantes nacidos en la comunidad de Ceuta, pasando del 0.51% al 0.51%.
- Disminuyen (-154) los habitantes nacidos en el resto de España, pasando del 17.81% al 17.71%.
- Disminuyen (-276) los habitantes nacidos en otros países, pasando del 12.89% al 12.62%.
- Aumentan (10.001) los habitantes nacidos en Ceuta, pasando del 69.01% al 69.16%.
- Disminuyen (-177) los habitantes nacidos en la la comunidad de Ceuta, pasando del 0.87% al 0.51%.
- Disminuyen (-904) los habitantes nacidos en el resto de España, pasando del 22.71% al 17.71%.
- Aumentan (5.400) los habitantes nacidos en otros países, pasando del 7.40% al 12.62%.
 |  |  |
Segun los datos ofrecidos por el INE en la estadistica del Padrón los habitantes empadronados en Ceuta que han nacido en otros países ascienden a 10.492. 
- 9157 habitantes, 4426 hombres y 4731 mujeres nacidos en África.
- 496 habitantes, 255 hombres y 241 mujeres nacidos en América.
- 272 habitantes, 139 hombres y 133 mujeres nacidos en Asia.
- 2 mujeres nacidas en Oceanía.


 |  |  |
| Habitantes segun Pais de Nacimiento | |||
| Pais | 2022 | Dif (2021) | |
| Bulgaria | 3 | 0 | |
| Francia | 191 | 7 | |
| Italia | 22 | -2 | |
| Polonia | 6 | -3 | |
| Portugal | 37 | 0 | |
| Reino Unido | 54 | -2 | |
| Alemania | 73 | 5 | |
| Rumanía | 14 | -4 | |
| Ucrania | 8 | -1 | |
| Rusia | 8 | 1 | |
| Argelia | 13 | 1 | |
| Marruecos | 9113 | -275 | |
| Nigeria | 6 | 0 | |
| Senegal | 1 | 0 | |
| Cuba | 22 | -2 | |
| República Dominicana | 15 | 1 | |
| Argentina | 69 | -3 | |
| Bolivia | 14 | 1 | |
| Brasil | 17 | -2 | |
| Colombia | 113 | 5 | |
| Chile | 12 | 0 | |
| Ecuador | 49 | 1 | |
| Paraguay | 9 | -2 | |
| Perú | 39 | 3 | |
| Uruguay | 13 | 6 | |
| Venezuela | 60 | 0 | |
| China | 107 | -3 | |
| Pakistán | 19 | -2 | |
| Otros | 385 | -6 | |

 |  |  |
Teniendo en cuenta la proporción de habitantes nacidos en otro pais sobre la población total del municipio, hemos realizado un ranking, en el que la 1ª posición esta ocupada por el municipio con una proporción mayor de habitantes nacidos en otro pais, aquí puede verse en que lugar esta el municipio de Ceuta y sus municipios cercanos.
| Top Municipal % Habitantes nacidos en otro pais | |||
| Provincia | Municipio | Pos | % |
| Cádiz | San Roque | 841 | 18,53 |
| Segovia | Villacastín | 1.008 | 17,26 |
| Albacete | Bonete | 2.011 | 12,62 |
| Ceuta | Ceuta | 2.012 | 12,62 |
| Castellon | Traiguera | 2.013 | 12,62 |
| Cádiz | Algeciras | 2.305 | 11,62 |
| Cádiz | Tarifa | 2.374 | 11,39 |
| Cádiz | La Línea de la Concepción | 2.376 | 11,38 |
| Cádiz | Castellar de la Frontera | 4.356 | 6,57 |
| Cádiz | Los Barrios | 4.487 | 6,34 |
 |  |  |
| Pirámide en otros Municipios |
La media de edad de los habitantes de Ceuta es de 38,42 años, 1,56 años mas que hace un lustro que era de 36,86 años.
En el siguiente mapa de Ceuta se puede ver la edad media de los habitantes del municipio por secciones censales según los datos de 2019.

 |  |  |
| Población de Ceuta por sexo y edad 2024 (grupos quinquenales) | |||
| Edad | Hombres | Mujeres | Total |
| 0-5 | 1.958 | 1.816 | 3.774 |
| 5-10 | 2.585 | 2.479 | 5.064 |
| 10-15 | 2.986 | 2.779 | 5.765 |
| 15-20 | 2.999 | 2.995 | 5.994 |
| 20-25 | 2.952 | 2.988 | 5.940 |
| 25-30 | 2.700 | 2.596 | 5.296 |
| 30-35 | 2.775 | 2.714 | 5.489 |
| 35-40 | 2.842 | 2.769 | 5.611 |
| 40-45 | 3.169 | 2.965 | 6.134 |
| 45-50 | 3.259 | 3.029 | 6.288 |
| 50-55 | 3.134 | 2.796 | 5.930 |
| 55-60 | 3.008 | 2.706 | 5.714 |
| 60-65 | 2.604 | 2.562 | 5.166 |
| 65-70 | 1.875 | 1.999 | 3.874 |
| 70-75 | 1.310 | 1.320 | 2.630 |
| 75-80 | 869 | 1.050 | 1.919 |
| 80-85 | 537 | 807 | 1.344 |
| 85- | 393 | 843 | 1.236 |
| Total | 41.957 | 41.222 | 83.179 |
La poblacion menor de 18 años en Ceuta es de 18.151 (9.261 H, 8.890 M ), el 21,8%.
La poblacion entre 18 y 65 años en Ceuta es de 54.916 (28.148 H, 26.768 M ), el 66,0%.
La poblacion mayor de 65 años en Ceuta es de 10.112 (4.548 H, 5.564 M ), el 12,2%.
 |  |  |
(Ir al Índice)
Crecimiento Natural o Vegetativo.
El crecimiento natural de la población en el municipio de Ceuta, según los últimos datos publicados por el INE para el año 2023 ha sido Positivo, con 123 nacimientos mas que defunciones.  |  |  |
Tabla con la evolución del número de nacimientos , defunciones y crecimiento vegetativo.
| Evolución Nacimientos y Defunciones desde 1996 hasta 2023 | |||
| Año | Nacimientos | Fallecidos | Diferencia |
| 2023 | 683 | 560 | 123 |
| 2022 | 728 | 615 | 113 |
| 2021 | 719 | 674 | 45 |
| 2020 | 843 | 648 | 195 |
| 2019 | 841 | 537 | 304 |
| 2018 | 972 | 535 | 437 |
| 2017 | 1.045 | 560 | 485 |
| 2016 | 1.060 | 508 | 552 |
| 2015 | 1.096 | 504 | 592 |
| 2014 | 1.202 | 509 | 693 |
| 2013 | 1.086 | 531 | 555 |
| 2012 | 1.128 | 487 | 641 |
| 2011 | 1.166 | 515 | 651 |
| 2010 | 1.192 | 536 | 656 |
| 2009 | 1.152 | 550 | 602 |
| 2008 | 1.165 | 497 | 668 |
| 2007 | 1.136 | 537 | 599 |
| 2006 | 1.041 | 479 | 562 |
| 2005 | 1.065 | 497 | 568 |
| 2004 | 1.061 | 491 | 570 |
| 2003 | 1.015 | 495 | 520 |
| 2002 | 1.023 | 509 | 514 |
| 2001 | 981 | 457 | 524 |
| 2000 | 996 | 451 | 545 |
| 1999 | 1.020 | 497 | 523 |
| 1998 | 981 | 526 | 455 |
| 1997 | 1.029 | 496 | 533 |
| 1996 | 963 | 513 | 450 |
(Ir al Índice)
Evolución número de Matrimonios.
En el siguiente grafico y tabla podemos ver la evolución en el número de matrimonios que se han otorgado en el Municipio de Ceuta hasta el año 2023.
 |  |  |
| Evolución Matrimonios desde 1996 hasta 2023 | |
| Año | Matrimonios |
| 2023 | 334 |
| 2022 | 537 |
| 2021 | 432 |
| 2020 | 257 |
| 2019 | 507 |
| 2018 | 431 |
| 2017 | 448 |
| 2016 | 497 |
| 2015 | 424 |
| 2014 | 395 |
| 2013 | 383 |
| 2012 | 409 |
| 2011 | 448 |
| 2010 | 400 |
| 2009 | 400 |
| 2008 | 369 |
| 2007 | 374 |
| 2006 | 325 |
| 2005 | 363 |
| 2004 | 375 |
| 2003 | 345 |
| 2002 | 330 |
| 2001 | 326 |
| 2000 | 322 |
| 1999 | 296 |
| 1998 | 314 |
| 1997 | 343 |
| 1996 | 351 |
(Ir al Índice)
Residentes en el extranjero.
Segun los datos publicados por el INE en el CERA, Censo Electoral de españoles residentes en el extranjero a 1 de Noviembre de 2024 los los españoles que residen habitualmente en el extranjero o han trasladado al extranjero su residencia habitual mayores de 18 años eran 3139 personas con municipio de origen en Ceuta.
 |  |  |
(Ir al Índice)
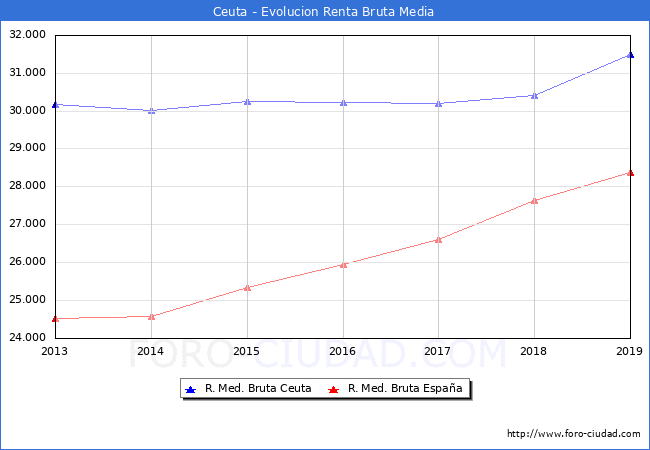
En 2019 Ceuta se sitúa como el municipio nº271 con una mayor renta bruta media a nivel Nacional (sin PV y Navarra), abajo se muestra una tabla con las posiciones en las que se encuentran los municipios cercanos y con población parecida.

Estadística del IRPF
Segun los datos hechos publicos por el Ministerio de Hacienda la renta bruta media por declarante, en el municipio de Ceuta en 2019 fue de 31.504€, 1.103€ mas que en el año 2018 . Una vez descontada la liquidacion por IRPF y lo aportado a la Seguridad Social la renta disponible media por declarante se situó en 28.362€, 955€ mas que en el año 2018.  |  |  |
| Evolución de la Renta Media en Ceuta | ||||
| Año | Renta Bruta | Var | Renta Dispo | Var |
| 2019 | 31.504€ | 1.103€ (3,50%) | 28.362€ | 955€ (3,37%) |
| 2018 | 30.401€ | 192€ (0,63%) | 27.407€ | 572€ (2,09%) |
| 2017 | 30.209€ | -25€ (-0,08%) | 26.835€ | -27€ (-0,10%) |
| 2016 | 30.234€ | -20€ (-0,07%) | 26.862€ | 47€ (0,17%) |
| 2015 | 30.254€ | 228€ (0,75%) | 26.815€ | 411€ (1,53%) |
| 2014 | 30.026€ | -142€ (-0,47%) | 26.404€ | -140€ (-0,53%) |
| 2013 | 30.168€ | 0€ (0,00%) | 26.544€ | 0€ (0,00%) |
En 2019 Ceuta se sitúa como el municipio nº271 con una mayor renta bruta media a nivel Nacional (sin PV y Navarra), abajo se muestra una tabla con las posiciones en las que se encuentran los municipios cercanos y con población parecida.
| Renta Municipios Cercanos | ||||
| Municipio | Renta Bruta | Pos Prov | Pos Comu | Pos Naci |
| Premià de Mar (Barcelona) | 31.514€ | 98 | 166 | 270 |
| Ceuta (Ceuta) | 31.504€ | 1 | 0 | 271 |
| Sant Pere de Vilamajor (Barcelona) | 31.480€ | 99 | 167 | 272 |
| Melilla (Melilla) | 30.175€ | 1 | 0 | 392 |
| Sevilla (Sevilla) | 29.866€ | 9 | 13 | 424 |
| Cádiz (Cádiz) | 29.055€ | 2 | 20 | 525 |
| Algeciras (Cádiz) | 28.887€ | 3 | 21 | 552 |
| La Línea de la Concepción (Cádiz) | 25.600€ | 7 | 42 | 1127 |
Indicadores de desigualdad.
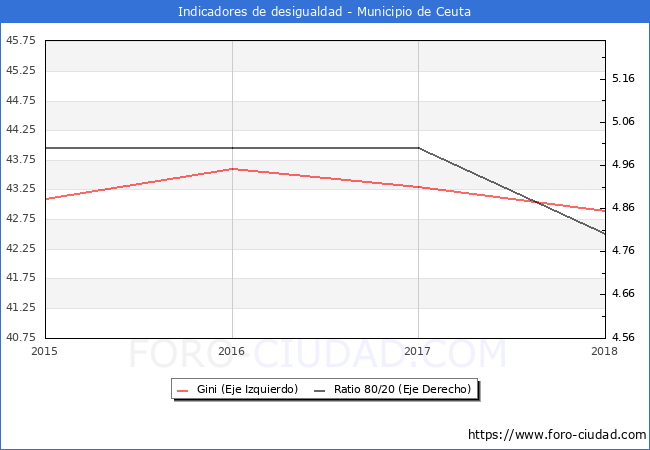
Íntimamente ligado a la pobreza se halla el concepto de desigualdad. Para entender mejor cómo afecta a la distribución de la renta en Ceuta, mostramos los valores de dos de los indicadores habituales encargados de reflejarla, el ratio 80/20 y el Índice de Gini.
En el año 2018 el Indice de Gini para Ceuta era de 42.90 y el ratio 80/20 era de 4.80.

Ratio 80/20 Cociente entre los ingresos totales del 20% de las personas con ingresos más elevados (percentil 80) y los ingresos totales del 20% de la población con menos ingresos (percentil 20).
El índice de Gini, es utilizado para analizar el grado de inequidad en la distribución respecto a los ingresos. Este indicador toma valores entre cero y uno (o entre 0 y 100 si se da en porcentaje); 0 cuando todas las personas tengan los mismos ingresos (perfecta igualdad), y 1 si todo el ingreso nacional está en manos de una única persona (perfecta desigualdad).
El índice de Gini, es utilizado para analizar el grado de inequidad en la distribución respecto a los ingresos. Este indicador toma valores entre cero y uno (o entre 0 y 100 si se da en porcentaje); 0 cuando todas las personas tengan los mismos ingresos (perfecta igualdad), y 1 si todo el ingreso nacional está en manos de una única persona (perfecta desigualdad).
| Indicadores en otros municipios | ||
| Municipio | Gini | Ratio 80/20 |
| Melilla | 43.30 | 4.70 |
| Cádiz | 32.20 | 2.70 |
| Algeciras | 36.30 | 3.50 |
| La Línea de la Concepción | 39.30 | 3.80 |
| Sevilla | 35.90 | 3.30 |
En el siguiente mapa de Ceuta se puede ver la renta per capita de los habitantes del municipio por secciones censales con los datos del año 2018.

 |  |  |
(Ir al Índice)
Precio Vivienda 3ºT 2024
Segun los datos hechos publicos por el Ministerio de Fomento, para los municipios de mas de 25.000 habitantes, el precio de la vivienda en Ceuta durante el 3º trimestre de 2024 , fue de 1.957 €/m2, un 0,4% mas que en el trimestre anterior .
 |  |  |
| Precio de la vivienda en otros Municipios |
(Ir al Índice)
El nº total de Transacciones de vivienda hasta el 3º Trimestre de 2024 ha sido de 490 un 23.12% mas que en el mismo periodo de 2023 (398).
A continuación se muestra la evolución de los últimos años de forma grafica:
Transacciones Inmobiliarias 3ºT 2024
Segun los datos del 3º Trimestre del 2024 publicados por el Ministerio de Vivienda, el nº de transacciones inmobiliarias en el municipio de Ceuta asciende a un total de 169, el 24.26% mas que en el 3T de 2023,de las cuales 7 son transacciones de viviendas nuevas y 162 de segunda mano.El nº total de Transacciones de vivienda hasta el 3º Trimestre de 2024 ha sido de 490 un 23.12% mas que en el mismo periodo de 2023 (398).
A continuación se muestra la evolución de los últimos años de forma grafica:

 |  |  |
(Ir al Índice)


Este grafico no es una imagen fiel de la población en edad de trabajar del municipio, debido a que la Seguridad Social, publica los Afiliados por municipio teniendo en cuenta el centro de trabajo y no la residencia del trabajador, por tanto en los municipios como capitales administrativas o municipios dormitorio los datos se alejaran de la realidad por el movimiento de trabajadores entre municipios.
Afiliados a la Seguridad Social a Agosto de 2025 .
| Agosto 2025 | Total Afiliados | Variacion | |||
| Mensual | Anual | ||||
| Absoluta | Relativa | Absoluta | Relativa | ||
| Total | 23984 | +189 | 0.79 % | +910 | 3.94 % |
| REGIMEN: | |||||
| GENERAL | 19806 | +184 | 0.94 % | +888 | 4.69 % |
| AUTONOMOS | 3042 | +5 | 0.16 % | -46 | -1.49 % |
| AGRARIO | 0 | 0 | 0 % | -5 | -100.00 % |
| HOGAR | 833 | +6 | 0.73 % | -14 | -1.65 % |
| MAR | 302 | -6 | -1.95 % | +86 | 39.81 % |
| CARBON | 0 | 0 | 0 % | 0 | 0 % |

| Afiliación en otros municipios | ||
| Municipio | Afiliados | Dif. Mes Ant. |
| Melilla | 25.206 | 293 |
| Cádiz | 92.322 | 1.293 |
| Algeciras | 29.469 | -141 |
| La Línea de la Concepción | 11.958 | 130 |
| Sevilla | 413.150 | 1.405 |

 |  |  |
(Ir al Índice)
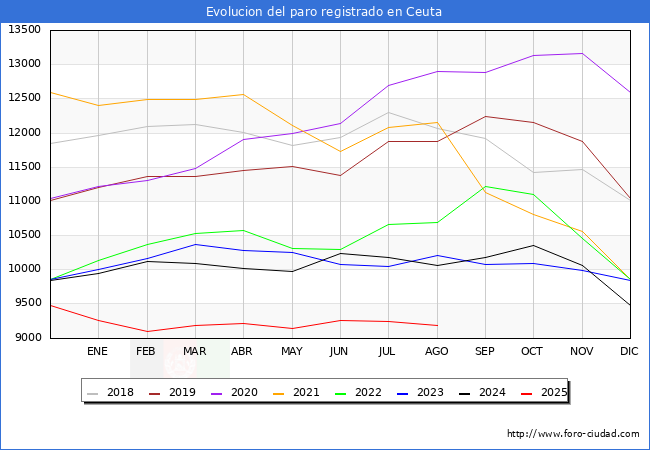
El número total de parados es de 9181, de los cuales 3327 son hombres y 5854 mujeres.
Las personas mayores de 45 años con 4343 parados son el grupo de edad mas afectado por el paro, seguido de los que se encuentran entre 25 y 44 años con 3849 parados, el grupo menos numeroso son los menores de 25 años con 989 parados.
Por sectores vemos que en el sector servicios es donde mayor número de parados existe en el municipio con 6967 personas, seguido de las personas sin empleo anterior con 1498 parados, la construcción con 402 parados, la industria con 278 parados y por ultimo la agricultura con 36 parados.
Paro registrado a Agosto de 2025.
Segun los datos publicados por el SEPE en el mes de Agosto el número de parados ha bajado en 63 personas. De las 63 personas que salieron de la lista del paro en Ceuta descendio en 45 hombres y 18 mujeres.El número total de parados es de 9181, de los cuales 3327 son hombres y 5854 mujeres.
Las personas mayores de 45 años con 4343 parados son el grupo de edad mas afectado por el paro, seguido de los que se encuentran entre 25 y 44 años con 3849 parados, el grupo menos numeroso son los menores de 25 años con 989 parados.
Por sectores vemos que en el sector servicios es donde mayor número de parados existe en el municipio con 6967 personas, seguido de las personas sin empleo anterior con 1498 parados, la construcción con 402 parados, la industria con 278 parados y por ultimo la agricultura con 36 parados.
| Agosto 2025 | Total Parados | Variacion | |||
| Mensual | Anual | ||||
| Absoluta | Relativa | Absoluta | Relativa | ||
| Total | 9181 | -63 | -0.68 % | -886 | -8.80 % |
| HOMBRES | 3327 | -45 | -1.33 % | -426 | -11.35 % |
| MUJERES | 5854 | -18 | -0.31 % | -460 | -7.29 % |
| MENORES DE 25 AÑOS: | 989 | +5 | 0.51 % | -157 | -13.70 % |
| HOMBRES | 458 | -12 | -2.55 % | -84 | -15.50 % |
| MUJERES | 531 | +17 | 3.31 % | -73 | -12.09 % |
| ENTRE 25 Y 44 AÑOS | 3849 | -43 | -1.10 % | -372 | -8.81 % |
| HOMBRES | 1204 | +18584 | 1,520.79 % | -145 | -10.75 % |
| MUJERES | 2645 | -25 | -0.94 % | -227 | -7.90 % |
| MAYORES DE 45 AÑOS | 4343 | -25 | -0.57 % | -357 | -7.60 % |
| HOMBRES | 1665 | -15 | -0.89 % | -197 | -10.58 % |
| MUJERES | 2678 | -10 | -0.37 % | -160 | -5.64 % |
| SECTOR: | |||||
| AGRICULTURA | 36 | -1 | -2.70 % | -2 | -5.26 % |
| INDUSTRIA | 278 | -10 | -3.47 % | +42 | 17.80 % |
| CONSTRUCCIÓN | 402 | -11 | -2.66 % | -55 | -12.04 % |
| SERVICIOS | 6967 | -4 | -0.06 % | -740 | -9.60 % |
| SIN EMPLEO ANTERIOR | 1498 | -37 | -2.41 % | -131 | -8.04 % |

 |  |  |
(Ir al Índice)
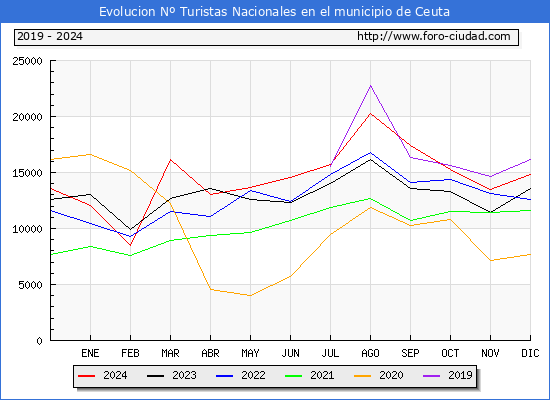
Los turistas de origen internacional ascendieron a 18.991 un 20,4% más que en el mismo mes de 2023 y el nº de turistas nacionales fue de 14.835 un 9,6% más.
El nº total de turistas que han visitado Ceuta de Enero a Diciembre de 2024 ha sido de 421.269 un 24,9% más que en el mismo periodo de 2023,el total de turistas de origen nacional ha sido de 174.952 (+12,1%) y los de origen internacional 246.317 (+35,9%).

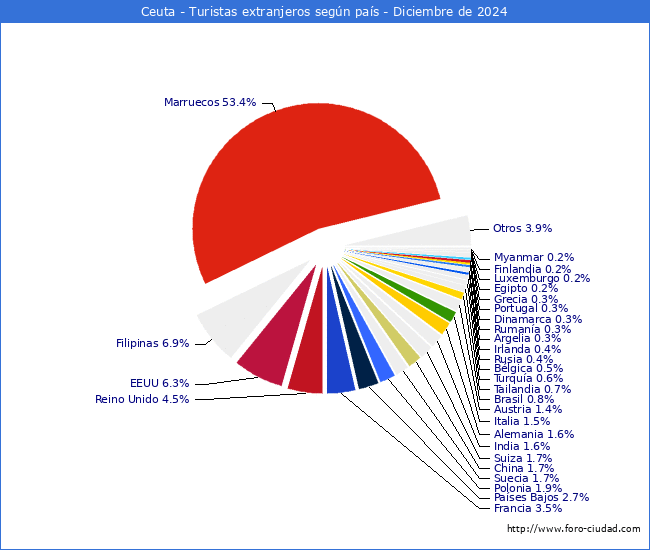
Estadisticas turísticas a Diciembre de 2024.
En Diciembre de 2024 el Nº de turistas que visitaron* Ceuta fue de 33.826 un 15,4% más que en Diciembre de 2023.Los turistas de origen internacional ascendieron a 18.991 un 20,4% más que en el mismo mes de 2023 y el nº de turistas nacionales fue de 14.835 un 9,6% más.
El nº total de turistas que han visitado Ceuta de Enero a Diciembre de 2024 ha sido de 421.269 un 24,9% más que en el mismo periodo de 2023,el total de turistas de origen nacional ha sido de 174.952 (+12,1%) y los de origen internacional 246.317 (+35,9%).


| Estadísticas turísticas en otros municipios | |||
| Municipio | Total Turistas Diciembre 2024 | Diferencia Diciembre 2023 | Top |
| Melilla | 21.433 | -2.980 (-12,2%) | 141 |
| Cádiz | 47.466 | -1.536 (-3,1%) | 61 |
| Algeciras | 66.129 | +4.961 (8,1%) | 38 |
| La Línea de la Concepción | 27.069 | -2.409 (-8,2%) | 109 |
| Sevilla | 365.900 | +24.574 (7,2%) | 3 |
*:Se consideran viajes turísticos todos los desplazamientos con destino principal fuera del lugar de residencia habitual de la persona, que implique una pernoctación fuera del mismo.
 |  |  |
(Ir al Índice)
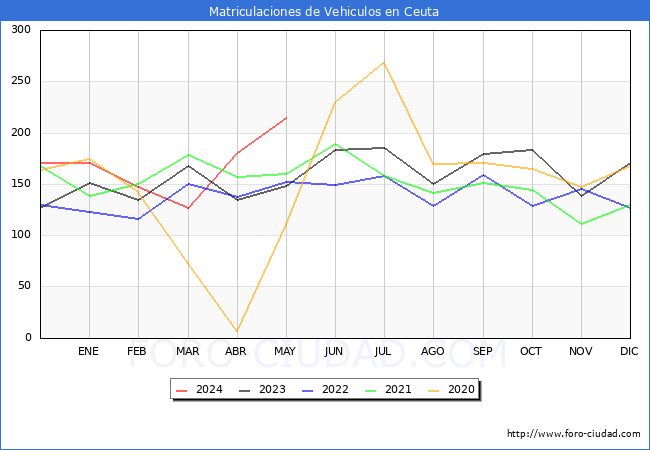
Matriculaciones vehículos en Mayo de 2024 .
| Matriculaciones | Mayo 2024 | Mayo 2023 | 12 Meses Interanual | 12 Meses Anteriores | ||||
| Mat | Dif | % | Mat | Dif | % | |||
| TOTAL | 214 | 148 | +66 | 44.59 % | 2025 | 1727 | +298 | 17.26 % |
| TURISMOS | 114 | 89 | +25 | 28.09 % | 1058 | 974 | +84 | 8.62 % |
| CAMIONES | 1 | 3 | -2 | -66.67 % | 8 | 17 | -9 | -52.94 % |
| AUTOBUSES | 14 | 0 | +14 | 100.00 % | 15 | 2 | +13 | 650.00 % |
| CAMIONETAS | 0 | 0 | 0 | 0.00 % | 17 | 16 | +1 | 6.25 % |
| TRACTORES | 0 | 0 | 0 | 0.00 % | 0 | 0 | 0 | 0.00 % |
| MOTOCICLETAS | 81 | 52 | +29 | 55.77 % | 872 | 678 | +194 | 28.61 % |
| CICLOMOTORES | 4 | 2 | +2 | 100.00 % | 35 | 24 | +11 | 45.83 % |
| OTROS | 0 | 2 | -2 | -100.00 % | 20 | 16 | +4 | 25.00 % |
| Matriculaciones en otros municipios | ||
| Municipio | Matriculaciones Mayo 2024 | Diferencia Mayo 2023 |
| Melilla | 184 | +28 (17.95%) |
| Cádiz | 217 | +27 (14.21%) |
| Algeciras | 281 | -8 (-2.77%) |
| La Línea de la Concepción | 112 | -13 (-10.40%) |
| Sevilla | 1.280 | -120 (-8.57%) |

 |  |  |
Elaboracion:Foro-ciudad.com (Se puede usar todo el contenido, insertando link a esta pagina).
Fuentes:
Instituto Nacional de Estadística
1900-1981: Poblaciones de hecho desde 1900 hasta 1991. Cifras oficiales sacadas de los Censos respectivos.
1986-1995: Poblaciones de derecho desde 1986 hasta 1995. Cifras de las rectificaciones y renovaciones Padrónales.
1996-2024: Cifras Oficiales de Población de los Municipios Españoles:Revisión del Padrón Municipal.
Medición del turismo a partir de la posición de los teléfonos móviles.
Ministerio de Hacienda y Administraciones Públicas
Agencia Tributaria
Servicio Público de Empleo Estatal
Seguridad Social
Ministerio de Fomento
DGT
Catastro *Datos no disponibles para Navarra y Pais Vasco.


