Demografia de Castrillón
Esta información pretende ofrecer una visión actual de la información demográfica puesta a disposición por el INE a través de sus diferentes publicaciones estadísticas, sobre todo usando como fuente el Padrón Municipal que se actualiza anualmente.
Mapa edad edificaciones
Evolución población 1900 hasta 2024
Habitantes segun lugar de nacimiento
Pirámide de población
Crecimiento Natural o Vegetativo
Numero de Matrimonios
Residentes en el Extranjero
Estadística del IRPF
Transacciones Inmobiliarias 3º Trimestre de 2024
Afiliados a la Seguridad Social a Febrero de 2025
Paro registrado a Febrero de 2025
Estadisticas Turismo a Diciembre de 2024
Matriculaciones vehículos en Mayo de 2024
Habitantes por Localidad
Habitantes en municipios cercanos
Habitantes provincia de Asturias 2024
(Ir al Índice)Evolución población 1900 hasta 2024
Habitantes segun lugar de nacimiento
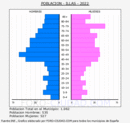
Pirámide de población
Crecimiento Natural o Vegetativo
Numero de Matrimonios
Residentes en el Extranjero
Estadística del IRPF
Transacciones Inmobiliarias 3º Trimestre de 2024
Afiliados a la Seguridad Social a Febrero de 2025
Paro registrado a Febrero de 2025
Estadisticas Turismo a Diciembre de 2024
Matriculaciones vehículos en Mayo de 2024
Habitantes por Localidad
Habitantes en municipios cercanos
Habitantes provincia de Asturias 2024
Mapa edad edificaciones.
En el siguiente mapa se puede observar la edad de los edificios de Castrillón, los datos provienen del Catastro y están actualizados a Octubre de 2019 .
Cada color representa una década, excepto el Negro que representa todos los edificios anteriores a 1900,que suele ser el casco histórico, en el mapa puede apreciarse como ha sido el desarrollo urbanístico de Castrillón a lo largo del tiempo.
En la tabla posterior podemos ver la cantidad de superficie construida (en m2) por década,así como la posición que ocupa el municipio en un Top nacional y provincial para cada década.
En la tabla posterior podemos ver la cantidad de superficie construida (en m2) por década,así como la posición que ocupa el municipio en un Top nacional y provincial para cada década.
| Superficie Construida | ||||
| Decada | % Total | Top Provincial | Top Nacional* | |
| <1900 | 5.64% | <- 19º -> | <- 191º -> | |
| 1900-1909 | 2.61% | <- 38º -> | <- 1046º -> | |
| 1910-1919 | 0.59% | <- 33º -> | <- 640º -> | |
| 1920-1929 | 1.19% | <- 26º -> | <- 851º -> | |
| 1930-1939 | 0.92% | <- 26º -> | <- 1146º -> | |
| 1940-1949 | 2.74% | <- 13º -> | <- 429º -> | |
| 1950-1959 | 4.94% | <- 12º -> | <- 302º -> | |
| 1960-1969 | 9.32% | <- 9º -> | <- 356º -> | |
| 1970-1979 | 23.60% | <- 6º -> | <- 276º -> | |
| 1980-1989 | 14.67% | <- 10º -> | <- 426º -> | |
| 1990-1999 | 11.82% | <- 9º -> | <- 614º -> | |
| 2000-2009 | 18.35% | <- 11º -> | <- 633º -> | |
| 2010-2019 | 3.63% | <- 11º -> | <- 522º -> | |
(Ir al Índice)
Evolución de la población desde 1900 hasta 2024.
Segun los datos publicados por el INE a 1 de Enero de 2024 el número de habitantes en Castrillón es de 22.124, 21 habitantes mas que el en el año 2023. En el grafico siguiente se puede ver cuantos habitantes tiene Castrillón a lo largo de los años.| Habitantes en otros municipios | ||
| Municipio | Habitantes | Diferencia (2023) |
| Oviedo | 220.543 | +2.959 |
| Avilés | 75.351 | -167 |
| Gijón | 268.561 | +248 |
| Illas | 1.034 | -27 |
| Soto del Barco | 3.807 | -11 |
Actualmente la densidad de poblacion en Castrillón es de 399,79 habitantes por Km2. Abajo se puede ver un mapa del casco urbano con las densidad de poblacion por secciones censales, en este caso se usa habitantes por 1.000m2. Se ha dividido por 1000 por lo que si se quiere pasar a Km2 solo hay que multiplicar su valor por 1000.

 |  |  |
Tabla con la evolución del número de hombres ,mujeres y total a lo largo de los años.
| Evolución de la población desde 1900 hasta 2024 | |||
| Año | Hombres | Mujeres | Total |
| 2024 | 10.649 | 11.475 | 22.124 |
| 2023 | 10.663 | 11.440 | 22.103 |
| 2022 | 10.769 | 11.466 | 22.235 |
| 2021 | 10.809 | 11.490 | 22.299 |
| 2020 | 10.774 | 11.499 | 22.273 |
| 2019 | 10.849 | 11.527 | 22.376 |
| 2018 | 10.894 | 11.570 | 22.464 |
| 2017 | 10.892 | 11.598 | 22.490 |
| 2016 | 10.974 | 11.652 | 22.626 |
| 2015 | 11.018 | 11.717 | 22.735 |
| 2014 | 11.064 | 11.752 | 22.816 |
| 2013 | 11.121 | 11.730 | 22.851 |
| 2012 | 11.174 | 11.776 | 22.950 |
| 2011 | 11.149 | 11.744 | 22.893 |
| 2010 | 11.150 | 11.682 | 22.832 |
| 2009 | 11.195 | 11.699 | 22.894 |
| 2008 | 11.165 | 11.678 | 22.843 |
| 2007 | 11.099 | 11.673 | 22.772 |
| 2006 | 11.112 | 11.743 | 22.855 |
| 2005 | 11.158 | 11.774 | 22.932 |
| 2004 | 11.150 | 11.739 | 22.889 |
| 2003 | 10.963 | 11.640 | 22.603 |
| 2002 | 10.922 | 11.612 | 22.534 |
| 2001 | 10.920 | 11.604 | 22.524 |
| 2000 | 10.965 | 11.628 | 22.593 |
| 1999 | 10.927 | 11.586 | 22.513 |
| 1998 | 10.900 | 11.557 | 22.457 |
| 1996 | 10.837 | 11.523 | 22.360 |
| 1995 | 10.972 | 11.595 | 22.567 |
| 1994 | 10.880 | 11.521 | 22.401 |
| 1993 | 10.763 | 11.396 | 22.159 |
| 1992 | 10.540 | 11.104 | 21.644 |
| 1991 | 10.328 | 10.907 | 21.235 |
| 1990 | 11.040 | 11.508 | 22.548 |
| 1989 | 11.006 | 11.493 | 22.499 |
| 1988 | 10.943 | 11.413 | 22.356 |
| 1987 | 10.819 | 11.260 | 22.079 |
| 1986 | 10.744 | 11.185 | 21.929 |
| 1981 | 0 | 0 | 20.181 |
| 1970 | 0 | 0 | 13.393 |
| 1960 | 0 | 0 | 12.382 |
| 1950 | 0 | 0 | 8.090 |
| 1940 | 0 | 0 | 7.331 |
| 1930 | 0 | 0 | 7.176 |
| 1920 | 0 | 0 | 6.794 |
| 1910 | 0 | 0 | 6.978 |
| 1900 | 0 | 0 | 6.162 |
(Ir al Índice)
Poblacion Máxima Estacional.
La población estacional máxima es una estimación de la población máxima que soporta Castrillón. En el cálculo se incluyen las personas que tienen algún tipo de vinculación o relación con el municipio, ya sea porque residen, trabajan, estudian o pasan algún período de tiempo en él. Los datos son publicados anualmente por el Ministerio de Hacienda y Administraciones Públicas, en colaboración con las Diputaciones Provinciales, Cabildos y Consejos Insulares.| Poblacion Estacional Máxima | |||
| Año | Personas | ||
| 2016 | 24.475 | ||
| 2015 | 24.558 | ||
| 2014 | 24.600 | ||
| 2013 | 24.720 | ||
| 2012 | 24.642 | ||
| 2011 | 24.561 | ||
| 2010 | 24.620 | ||
| 2009 | 24.584 | ||
| 2008 | 22.013 | ||
| 2005 | 24.533 | ||
| 2000 | 23.319 | ||
(Ir al Índice)
Habitantes segun lugar de nacimiento.
Según los datos publicados por el INE procedentes del padrón municipal de 2022 el 18.60% (4.135) de los habitantes empadronados en el Municipio de Castrillón han nacido en dicho municipio, el 76.79% han emigrado a Castrillón desde diferentes lugares de España, el 62.28% (13.848) desde otros municipios de la provincia de Asturias, el 14.51% (3.226) desde otras comunidades autónomas y el 4.61% (1.026) han emigrado a Castrillón desde otros países.
 |  |  |
En el siguiente gráfico podemos ver la evolución de la estructura de la población en el municipio de Castrillón si lo comparamos con 2021 vemos
- Disminuyen (-5) los habitantes nacidos en Castrillón, pasando del 18.57% al 18.60%.
- Disminuyen (-34) los habitantes nacidos en la provincia de Asturias, pasando del 62.25% al 62.28%.
- Disminuyen (-28) los habitantes nacidos en el resto de España, pasando del 14.59% al 14.51%.
- Aumentan (3) los habitantes nacidos en otros países, pasando del 4.59% al 4.61%.
- Disminuyen (-504) los habitantes nacidos en Castrillón, pasando del 20.75% al 18.60%.
- Aumentan (295) los habitantes nacidos en la provincia de Asturias, pasando del 60.61% al 62.28%.
- Disminuyen (-520) los habitantes nacidos en el resto de España, pasando del 16.75% al 14.51%.
- Aumentan (604) los habitantes nacidos en otros países, pasando del 1.89% al 4.61%.
 |  |  |
Segun los datos ofrecidos por el INE en la estadistica del Padrón los habitantes empadronados en Castrillón que han nacido en otros países ascienden a 1.026. 
- 565 habitantes, 220 hombres y 345 mujeres nacidos en América.
- 58 habitantes, 27 hombres y 31 mujeres nacidos en África.
- 37 habitantes, 19 hombres y 18 mujeres nacidos en Asia.
- 7 habitantes, 4 hombres y 3 mujeres nacidos en Oceanía.


 |  |  |
| Habitantes segun Pais de Nacimiento | |||
| Pais | 2022 | Dif (2021) | |
| Bulgaria | 6 | 0 | |
| Francia | 49 | 0 | |
| Italia | 13 | 3 | |
| Polonia | 10 | 2 | |
| Portugal | 54 | 0 | |
| Reino Unido | 23 | 2 | |
| Alemania | 30 | 2 | |
| Rumanía | 45 | -8 | |
| Ucrania | 7 | 1 | |
| Rusia | 6 | 0 | |
| Argelia | 6 | -1 | |
| Marruecos | 30 | 2 | |
| Nigeria | 2 | -1 | |
| Senegal | 6 | -3 | |
| Cuba | 114 | 1 | |
| República Dominicana | 25 | 0 | |
| Argentina | 66 | 3 | |
| Bolivia | 6 | 1 | |
| Brasil | 84 | -3 | |
| Colombia | 52 | 1 | |
| Chile | 5 | 0 | |
| Ecuador | 18 | -1 | |
| Paraguay | 42 | 8 | |
| Perú | 15 | 2 | |
| Uruguay | 29 | 0 | |
| Venezuela | 59 | -2 | |
| China | 17 | 5 | |
| Pakistán | 4 | -6 | |
| Otros | 203 | -5 | |

 |  |  |
Teniendo en cuenta la proporción de habitantes nacidos en otro pais sobre la población total del municipio, hemos realizado un ranking, en el que la 1ª posición esta ocupada por el municipio con una proporción mayor de habitantes nacidos en otro pais, aquí puede verse en que lugar esta el municipio de Castrillón y sus municipios cercanos.
| Top Municipal % Habitantes nacidos en otro pais | |||
| Provincia | Municipio | Pos | % |
| Leon | Igüeña | 2.744 | 10,29 |
| Asturias | Avilés | 4.110 | 7,00 |
| Asturias | Muros de Nalón | 4.876 | 5,65 |
| Asturias | Corvera de Asturias | 5.187 | 5,13 |
| Córdoba | La Carlota | 5.484 | 4,61 |
| Asturias | Castrillón | 5.485 | 4,61 |
| Caceres | Acebo | 5.486 | 4,61 |
| Asturias | Las Regueras | 5.616 | 4,40 |
| Asturias | Soto del Barco | 5.767 | 4,15 |
| Asturias | Illas | 6.744 | 2,64 |
 |  |  |
La media de edad de los habitantes de Castrillón es de 48,13 años, 1,63 años mas que hace un lustro que era de 46,50 años.
En el siguiente mapa de Castrillón se puede ver la edad media de los habitantes del municipio por secciones censales según los datos de 2019.

 |  |  |
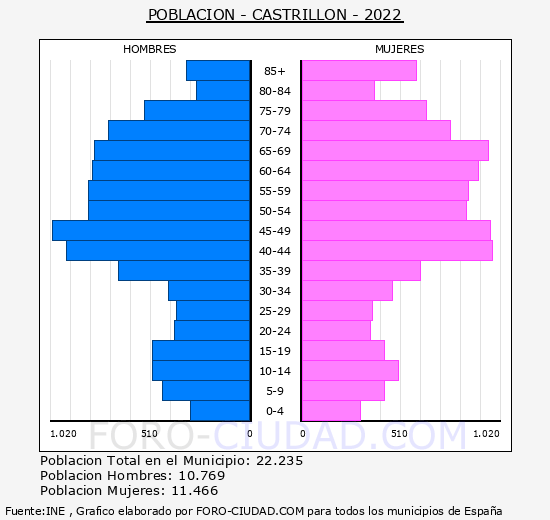
| Población de Castrillón por sexo y edad 2022 (grupos quinquenales) | |||
| Edad | Hombres | Mujeres | Total |
| 0-5 | 311 | 313 | 624 |
| 5-10 | 456 | 434 | 890 |
| 10-15 | 508 | 509 | 1.017 |
| 15-20 | 501 | 429 | 930 |
| 20-25 | 391 | 358 | 749 |
| 25-30 | 381 | 373 | 754 |
| 30-35 | 427 | 470 | 897 |
| 35-40 | 680 | 614 | 1.294 |
| 40-45 | 942 | 987 | 1.929 |
| 45-50 | 1.015 | 976 | 1.991 |
| 50-55 | 829 | 851 | 1.680 |
| 55-60 | 830 | 866 | 1.696 |
| 60-65 | 810 | 914 | 1.724 |
| 65-70 | 804 | 965 | 1.769 |
| 70-75 | 732 | 774 | 1.506 |
| 75-80 | 547 | 649 | 1.196 |
| 80-85 | 276 | 387 | 663 |
| 85- | 329 | 597 | 926 |
| Total | 10.769 | 11.466 | 22.235 |
La poblacion menor de 18 años en Castrillón es de 3.103 (1.586 H, 1.517 M ), el 14,0%.
La poblacion entre 18 y 65 años en Castrillón es de 13.450 (6.669 H, 6.781 M ), el 60,5%.
La poblacion mayor de 65 años en Castrillón es de 5.682 (2.514 H, 3.168 M ), el 25,6%.
 |  |  |
(Ir al Índice)
Crecimiento Natural o Vegetativo.
El crecimiento natural de la población en el municipio de Castrillón, según los últimos datos publicados por el INE para el año 2022 ha sido Negativo, con 187 defunciones mas que nacimientos.  |  |  |
Tabla con la evolución del número de nacimientos , defunciones y crecimiento vegetativo.
| Evolución Nacimientos y Defunciones desde 1996 hasta 2022 | |||
| Año | Nacimientos | Fallecidos | Diferencia |
| 2022 | 93 | 280 | -187 |
| 2021 | 104 | 267 | -163 |
| 2020 | 100 | 242 | -142 |
| 2019 | 118 | 239 | -121 |
| 2018 | 126 | 228 | -102 |
| 2017 | 134 | 241 | -107 |
| 2016 | 134 | 198 | -64 |
| 2015 | 141 | 230 | -89 |
| 2014 | 157 | 238 | -81 |
| 2013 | 154 | 205 | -51 |
| 2012 | 180 | 209 | -29 |
| 2011 | 192 | 216 | -24 |
| 2010 | 190 | 213 | -23 |
| 2009 | 185 | 189 | -4 |
| 2008 | 187 | 206 | -19 |
| 2007 | 173 | 185 | -12 |
| 2006 | 172 | 169 | 3 |
| 2005 | 175 | 193 | -18 |
| 2004 | 153 | 217 | -64 |
| 2003 | 169 | 240 | -71 |
| 2002 | 135 | 196 | -61 |
| 2001 | 122 | 195 | -73 |
| 2000 | 126 | 175 | -49 |
| 1999 | 126 | 218 | -92 |
| 1998 | 112 | 181 | -69 |
| 1997 | 136 | 147 | -11 |
| 1996 | 105 | 201 | -96 |
(Ir al Índice)
Evolución número de Matrimonios.
En el siguiente grafico y tabla podemos ver la evolución en el número de matrimonios que se han otorgado en el Municipio de Castrillón hasta el año 2022.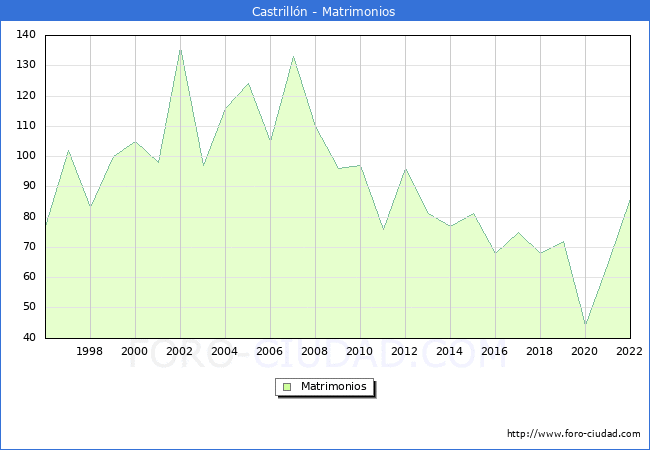
 |  |  |
| Evolución Matrimonios desde 1996 hasta 2022 | |
| Año | Matrimonios |
| 2022 | 86 |
| 2021 | 65 |
| 2020 | 44 |
| 2019 | 72 |
| 2018 | 68 |
| 2017 | 75 |
| 2016 | 68 |
| 2015 | 81 |
| 2014 | 77 |
| 2013 | 81 |
| 2012 | 96 |
| 2011 | 76 |
| 2010 | 97 |
| 2009 | 96 |
| 2008 | 110 |
| 2007 | 133 |
| 2006 | 105 |
| 2005 | 124 |
| 2004 | 116 |
| 2003 | 97 |
| 2002 | 136 |
| 2001 | 98 |
| 2000 | 105 |
| 1999 | 100 |
| 1998 | 83 |
| 1997 | 102 |
| 1996 | 77 |
(Ir al Índice)
Residentes en el extranjero.
Segun los datos publicados por el INE en el CERA, Censo Electoral de españoles residentes en el extranjero a 1 de Noviembre de 2024 los los españoles que residen habitualmente en el extranjero o han trasladado al extranjero su residencia habitual mayores de 18 años eran 837 personas con municipio de origen en Castrillón.
 |  |  |
(Ir al Índice)
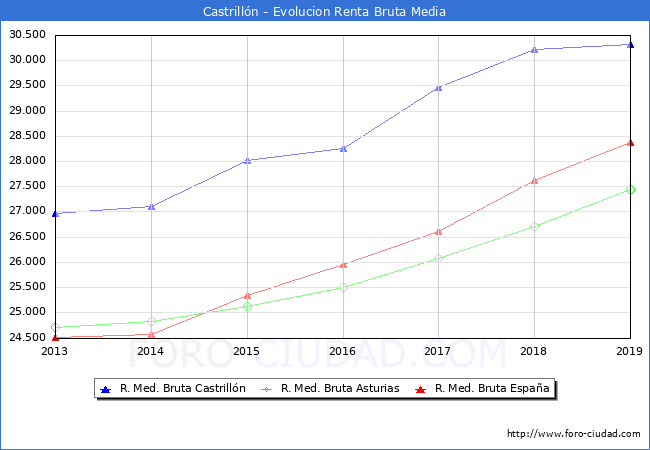
En 2019 Castrillón se sitúa como el municipio nº2 con una mayor renta bruta media en la comunidad de Asturias y el nº381 a nivel Nacional (sin PV y Navarra), abajo se muestra una tabla con las posiciones en las que se encuentran los municipios cercanos y con población parecida.
Los habitantes de Castrillón liquidaron 53.680.764€ en concepto de IRPF en el año 2019 y recibieron por parte de las diferentes administraciones de forma directa en el presupuesto municipal (capitulo 4 Y 7) 8.280.053€ un 15,42% de lo aportado, en la siguiente tabla podemos ver las cifras de los municipios cercanos o de población similar.

Estadística del IRPF
Segun los datos hechos publicos por el Ministerio de Hacienda la renta bruta media por declarante, en el municipio de Castrillón en 2019 fue de 30.330€, 106€ mas que en el año 2018 . Una vez descontada la liquidacion por IRPF y lo aportado a la Seguridad Social la renta disponible media por declarante se situó en 24.702€, 84€ mas que en el año 2018.  |  |  |
| Evolución de la Renta Media en Castrillón | ||||
| Año | Renta Bruta | Var | Renta Dispo | Var |
| 2019 | 30.330€ | 106€ (0,35%) | 24.702€ | 84€ (0,34%) |
| 2018 | 30.224€ | 751€ (2,48%) | 24.618€ | 663€ (2,69%) |
| 2017 | 29.473€ | 1.213€ (4,12%) | 23.955€ | 803€ (3,35%) |
| 2016 | 28.260€ | 233€ (0,82%) | 23.152€ | 162€ (0,70%) |
| 2015 | 28.027€ | 922€ (3,29%) | 22.990€ | 981€ (4,27%) |
| 2014 | 27.105€ | 142€ (0,52%) | 22.009€ | 110€ (0,50%) |
| 2013 | 26.963€ | 0€ (0,00%) | 21.899€ | 0€ (0,00%) |
En 2019 Castrillón se sitúa como el municipio nº2 con una mayor renta bruta media en la comunidad de Asturias y el nº381 a nivel Nacional (sin PV y Navarra), abajo se muestra una tabla con las posiciones en las que se encuentran los municipios cercanos y con población parecida.
| Renta Municipios Cercanos | ||||
| Municipio | Renta Bruta | Pos Prov | Pos Comu | Pos Naci |
| Oviedo (Asturias) | 30.468€ | 1 | 1 | 365 |
| Castell-Platja d'Aro (Girona) | 30.335€ | 81 | 241 | 380 |
| Castrillón (Asturias) | 30.330€ | 2 | 2 | 381 |
| Gelves (Sevilla) | 30.310€ | 8 | 11 | 382 |
| Gijón (Asturias) | 28.281€ | 4 | 4 | 636 |
| Avilés (Asturias) | 27.432€ | 9 | 9 | 766 |
| Illas (Asturias) | 26.553€ | 13 | 13 | 934 |
| Soto del Barco (Asturias) | 25.991€ | 20 | 20 | 1043 |
Los habitantes de Castrillón liquidaron 53.680.764€ en concepto de IRPF en el año 2019 y recibieron por parte de las diferentes administraciones de forma directa en el presupuesto municipal (capitulo 4 Y 7) 8.280.053€ un 15,42% de lo aportado, en la siguiente tabla podemos ver las cifras de los municipios cercanos o de población similar.
| Liquidación IPRF vs Presupuesto Ayuntamiento | |||
| Municipio | Liquidación | Capitulo 4 y 7 Presupuesto | % |
| Oviedo (Asturias) | 553.857.396€ | 58.879.484€ | 10,63 % |
| Castell-Platja d'Aro (Girona) | 20.947.362€ | 3.828.205€ | 18,28 % |
| Castrillón (Asturias) | 53.680.764€ | 8.280.053€ | 15,42 % |
| Gelves (Sevilla) | 22.695.248€ | 4.690.398€ | 20,67 % |
| Gijón (Asturias) | 555.640.693€ | 83.799.787€ | 15,08 % |
| Avilés (Asturias) | 143.813.623€ | 24.796.698€ | 17,24 % |
| Illas (Asturias) | 1.745.866€ | 569.747€ | 32,63 % |
| Soto del Barco (Asturias) | 6.248.038€ | 1.053.603€ | 16,86 % |
Indicadores de desigualdad.
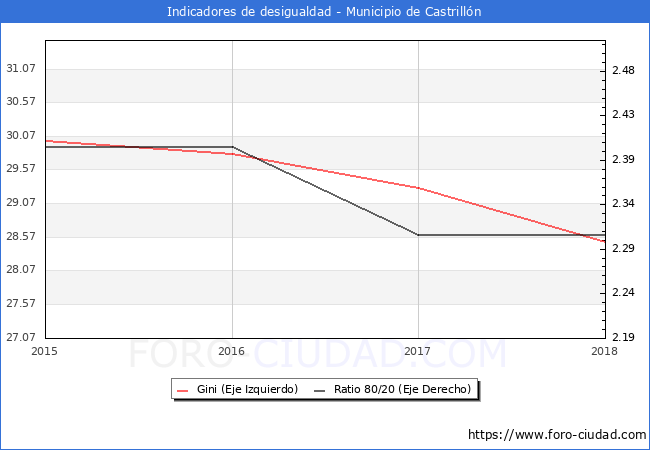
Íntimamente ligado a la pobreza se halla el concepto de desigualdad. Para entender mejor cómo afecta a la distribución de la renta en Castrillón, mostramos los valores de dos de los indicadores habituales encargados de reflejarla, el ratio 80/20 y el Índice de Gini.
En el año 2018 el Indice de Gini para Castrillón era de 28.50 y el ratio 80/20 era de 2.30.

Ratio 80/20 Cociente entre los ingresos totales del 20% de las personas con ingresos más elevados (percentil 80) y los ingresos totales del 20% de la población con menos ingresos (percentil 20).
El índice de Gini, es utilizado para analizar el grado de inequidad en la distribución respecto a los ingresos. Este indicador toma valores entre cero y uno (o entre 0 y 100 si se da en porcentaje); 0 cuando todas las personas tengan los mismos ingresos (perfecta igualdad), y 1 si todo el ingreso nacional está en manos de una única persona (perfecta desigualdad).
El índice de Gini, es utilizado para analizar el grado de inequidad en la distribución respecto a los ingresos. Este indicador toma valores entre cero y uno (o entre 0 y 100 si se da en porcentaje); 0 cuando todas las personas tengan los mismos ingresos (perfecta igualdad), y 1 si todo el ingreso nacional está en manos de una única persona (perfecta desigualdad).
| Indicadores en otros municipios | ||
| Municipio | Gini | Ratio 80/20 |
| Oviedo | 33.20 | 2.90 |
| Avilés | 29.90 | 2.50 |
| Gijón | 31.40 | 2.60 |
| Illas | 26.60 | 2.30 |
| Soto del Barco | 27.00 | 2.30 |
En el siguiente mapa de Castrillón se puede ver la renta per capita de los habitantes del municipio por secciones censales con los datos del año 2018.

 |  |  |
(Ir al Índice)
El nº total de Transacciones de vivienda hasta el 3º Trimestre de 2024 ha sido de 188 un -7.84% menos que en el mismo periodo de 2023 (204).
A continuación se muestra la evolución de los últimos años de forma grafica:
Transacciones Inmobiliarias 3ºT 2024
Segun los datos del 3º Trimestre del 2024 publicados por el Ministerio de Vivienda, el nº de transacciones inmobiliarias en el municipio de Castrillón asciende a un total de 55, el -26.67% menos que en el 3T de 2023,de las cuales 0 son transacciones de viviendas nuevas y 55 de segunda mano.El nº total de Transacciones de vivienda hasta el 3º Trimestre de 2024 ha sido de 188 un -7.84% menos que en el mismo periodo de 2023 (204).
A continuación se muestra la evolución de los últimos años de forma grafica:

 |  |  |
(Ir al Índice)


Este grafico no es una imagen fiel de la población en edad de trabajar del municipio, debido a que la Seguridad Social, publica los Afiliados por municipio teniendo en cuenta el centro de trabajo y no la residencia del trabajador, por tanto en los municipios como capitales administrativas o municipios dormitorio los datos se alejaran de la realidad por el movimiento de trabajadores entre municipios.
Afiliados a la Seguridad Social a Febrero de 2025 .
| Febrero 2025 | Total Afiliados | Variacion | |||
| Mensual | Anual | ||||
| Absoluta | Relativa | Absoluta | Relativa | ||
| Total | 5400 | +16 | 0.30 % | +56 | 1.05 % |
| REGIMEN: | |||||
| GENERAL | 3669 | +30 | 0.82 % | +57 | 1.58 % |
| AUTONOMOS | 1443 | -12 | -0.82 % | +2 | 0.14 % |
| AGRARIO | 11 | +1 | 10.00 % | +2 | 22.22 % |
| HOGAR | 212 | -6 | -2.75 % | -13 | -5.78 % |
| MAR | 65 | +3 | 4.84 % | +8 | 14.04 % |
| CARBON | 0 | 0 | 0 % | 0 | 0 % |

| Afiliación en otros municipios | ||
| Municipio | Afiliados | Dif. Mes Ant. |
| Oviedo | 129.298 | 576 |
| Avilés | 20.864 | 136 |
| Gijón | 85.534 | 855 |
| Illas | 143 | 1 |
| Soto del Barco | 769 | 31 |

 |  |  |
(Ir al Índice)
El número total de parados es de 1029, de los cuales 386 son hombres y 643 mujeres.
Las personas mayores de 45 años con 603 parados son el grupo de edad mas afectado por el paro, seguido de los que se encuentran entre 25 y 44 años con 340 parados, el grupo menos numeroso son los menores de 25 años con 86 parados.
Por sectores vemos que en el sector servicios es donde mayor número de parados existe en el municipio con 796 personas, seguido de la industria con 105 parados, las personas sin empleo anterior con 63 parados, la construcción con 51 parados y por ultimo la agricultura con 14 parados.
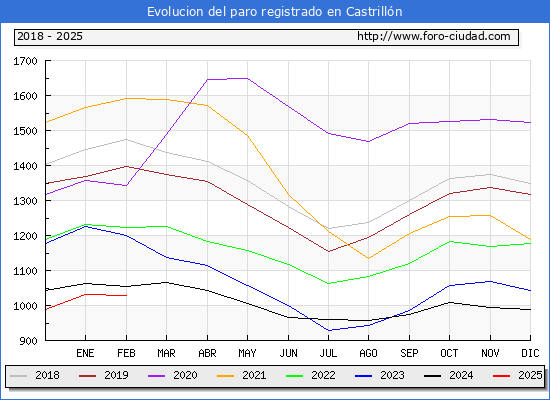
Paro registrado a Febrero de 2025.
Segun los datos publicados por el SEPE en el mes de Febrero el número de parados ha bajado en 3 personas. De las 3 personas que salieron de la lista del paro en Castrillón descendio en 13 hombres y aumento en 10 mujeres.El número total de parados es de 1029, de los cuales 386 son hombres y 643 mujeres.
Las personas mayores de 45 años con 603 parados son el grupo de edad mas afectado por el paro, seguido de los que se encuentran entre 25 y 44 años con 340 parados, el grupo menos numeroso son los menores de 25 años con 86 parados.
Por sectores vemos que en el sector servicios es donde mayor número de parados existe en el municipio con 796 personas, seguido de la industria con 105 parados, las personas sin empleo anterior con 63 parados, la construcción con 51 parados y por ultimo la agricultura con 14 parados.
| Febrero 2025 | Total Parados | Variacion | |||
| Mensual | Anual | ||||
| Absoluta | Relativa | Absoluta | Relativa | ||
| Total | 1029 | -3 | -0.29 % | -24 | -2.28 % |
| HOMBRES | 386 | -13 | -3.26 % | -5 | -1.28 % |
| MUJERES | 643 | +10 | 1.58 % | -19 | -2.87 % |
| MENORES DE 25 AÑOS: | 86 | -1 | -1.15 % | +8 | 10.26 % |
| HOMBRES | 46 | -2 | -4.17 % | +6 | 15.00 % |
| MUJERES | 40 | +1 | 2.56 % | +2 | 5.26 % |
| ENTRE 25 Y 44 AÑOS | 340 | +2 | 0.59 % | -19 | -5.29 % |
| HOMBRES | 122 | +3544 | 2,835.20 % | -2 | -1.61 % |
| MUJERES | 218 | +5 | 2.35 % | -17 | -7.23 % |
| MAYORES DE 45 AÑOS | 603 | -4 | -0.66 % | -13 | -2.11 % |
| HOMBRES | 218 | -8 | -3.54 % | -9 | -3.96 % |
| MUJERES | 385 | +4 | 1.05 % | -4 | -1.03 % |
| SECTOR: | |||||
| AGRICULTURA | 14 | +2 | 16.67 % | -2 | -12.50 % |
| INDUSTRIA | 105 | -2 | -1.87 % | +17 | 19.32 % |
| CONSTRUCCIÓN | 51 | -2 | -3.77 % | -14 | -21.54 % |
| SERVICIOS | 796 | -3 | -0.38 % | -27 | -3.28 % |
| SIN EMPLEO ANTERIOR | 63 | +2 | 3.28 % | +2 | 3.28 % |

 |  |  |
(Ir al Índice)
Los turistas de origen internacional ascendieron a 846 un 39,6% más que en el mismo mes de 2023 y el nº de turistas nacionales fue de 3.480 un 4,8% más.
El nº total de turistas que han visitado Castrillón de Enero a Diciembre de 2024 ha sido de 61.522 un -0,8% menos que en el mismo periodo de 2023,el total de turistas de origen nacional ha sido de 50.278 (-3,4%) y los de origen internacional 11.244 (+13,2%).
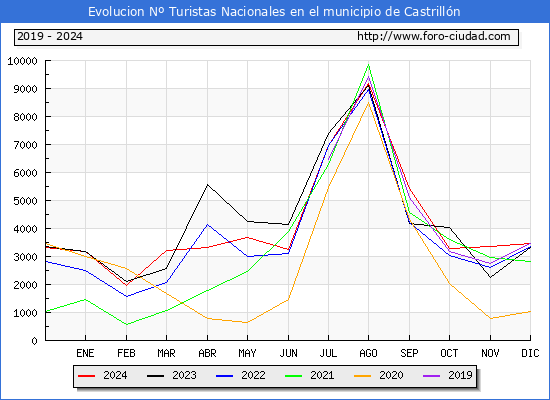

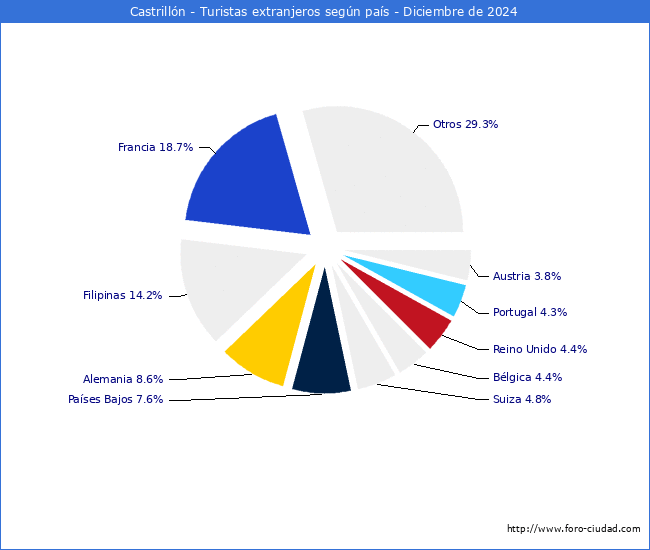
Estadisticas turísticas a Diciembre de 2024.
En Diciembre de 2024 el Nº de turistas que visitaron* Castrillón fue de 4.326 un 10,2% más que en Diciembre de 2023.Los turistas de origen internacional ascendieron a 846 un 39,6% más que en el mismo mes de 2023 y el nº de turistas nacionales fue de 3.480 un 4,8% más.
El nº total de turistas que han visitado Castrillón de Enero a Diciembre de 2024 ha sido de 61.522 un -0,8% menos que en el mismo periodo de 2023,el total de turistas de origen nacional ha sido de 50.278 (-3,4%) y los de origen internacional 11.244 (+13,2%).


| Estadísticas turísticas en otros municipios | |||
| Municipio | Total Turistas Diciembre 2024 | Diferencia Diciembre 2023 | Top |
| Oviedo | 61.279 | +3.240 (5,6%) | 44 |
| Avilés | 13.023 | +583 (4,7%) | 219 |
| Gijón | 63.872 | +2.297 (3,7%) | 42 |
| Illas | 125 | 125 (-100,0%) | 5.734 |
| Soto del Barco | 1.710 | +146 (9,3%) | 1.607 |
*:Se consideran viajes turísticos todos los desplazamientos con destino principal fuera del lugar de residencia habitual de la persona, que implique una pernoctación fuera del mismo.
 |  |  |
(Ir al Índice)
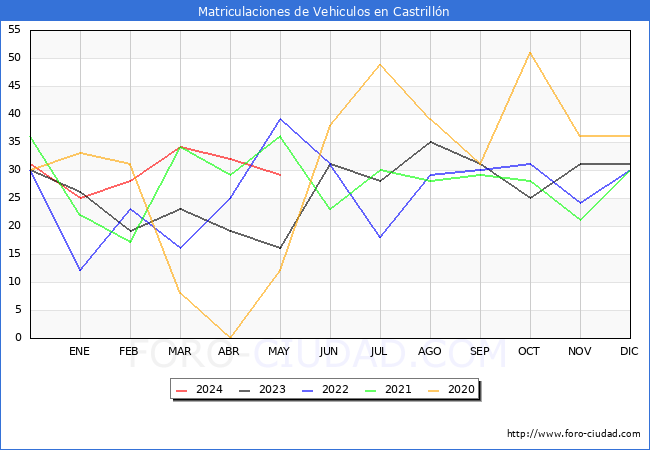
Matriculaciones vehículos en Mayo de 2024 .
| Matriculaciones | Mayo 2024 | Mayo 2023 | 12 Meses Interanual | 12 Meses Anteriores | ||||
| Mat | Dif | % | Mat | Dif | % | |||
| TOTAL | 29 | 16 | +13 | 81.25 % | 360 | 296 | +64 | 21.62 % |
| TURISMOS | 21 | 7 | +14 | 200.00 % | 261 | 210 | +51 | 24.29 % |
| CAMIONES | 0 | 1 | -1 | -100.00 % | 9 | 14 | -5 | -35.71 % |
| AUTOBUSES | 0 | 0 | 0 | 0.00 % | 0 | 0 | 0 | 0.00 % |
| CAMIONETAS | 0 | 1 | -1 | -100.00 % | 6 | 9 | -3 | -33.33 % |
| TRACTORES | 1 | 0 | +1 | 100.00 % | 1 | 0 | +1 | 100.00 % |
| MOTOCICLETAS | 7 | 4 | +3 | 75.00 % | 70 | 49 | +21 | 42.86 % |
| CICLOMOTORES | 0 | 1 | -1 | -100.00 % | 1 | 2 | -1 | -50.00 % |
| OTROS | 0 | 2 | -2 | -100.00 % | 12 | 12 | 0 | 0.00 % |
| Matriculaciones en otros municipios | ||
| Municipio | Matriculaciones Mayo 2024 | Diferencia Mayo 2023 |
| Oviedo | 360 | +17 (4.96%) |
| Avilés | 124 | 0 (0.00%) |
| Gijón | 445 | +71 (18.98%) |
| Illas | 3 | +1 (50.00%) |
| Soto del Barco | 6 | +3 (100.00%) |

 |  |  |
(Ir al Índice)
Habitantes en localidades del Municipio.
- Altamira (2000-2023)
- Alto del Barrero (2000-2023)
- Arancés (2000-2023)
- Arnáu (2000-2023)
- Barca (2000-2023)
- Bayas (2000-2023)
- Bellay (2000-2023)
- Berruga (2000-2023)
- Buxande (2000-2023)
- Calin (2000-2023)
- Canalón (2000-2023)
- Cuenza (2000-2023)
- Cueva de Arbedales (2000-2023)
- El Aguaduz (2000-2023)
- El Bolao (2000-2023)
- El Cabildo (2000-2023)
- El Calamón (2000-2023)
- El Caliero (2000-2023)
- El Castru (2000-2023)
- El Cenizal (2000-2023)
- El Censo (2000-2023)
- El Cordel (2000-2023)
- El Cuadro (2000-2023)
- El Cueplo (2000-2023)
- El Forcón (2000-2023)
- El Gallo (2000-2023)
- El Monte (2000-2023)
- El Muro (2000-2023)
- El Omedo (2000-2023)
- El Otero (2000-2023)
- El Pradón (2000-2023)
- El Puertu (2000-2023)
- El Reguero (2000-2023)
- El Riego (2000-2023)
- El Truébano (2000-2023)
- El Ventorrillu (2000-2023)
- Elvas (2000-2023)
- Ferralgo (2000-2023)
- Fondón (2000-2023)
- Fontaniella (2000-2023)
- Fontolaya (2000-2023)
- Garabiza (2000-2023)
- Infiesta (2000-2023)
- La Banda (2000-2023)
- La Braña (2000-2023)
- La Cabornia (2000-2023)
- La Campa (2000-2023)
- La Cangueta (2000-2023)
- La Castañalona (2000-2023)
- La Cruz d'Illes (2000-2023)
- La Curtia (2000-2023)
- La Envidia (2000-2023)
- La Fábrica (2000-2023)
- La Grandera (2000-2023)
- La Llada (2000-2023)
- La Lleñada (2000-2023)
- La Lloba (2000-2023)
- La Machuquera (2000-2023)
- La Mina (2000-2023)
- La Muriégana (2000-2023)
- La Parra (2000-2023)
- La Plata (2000-2023)
- La Quiona (2000-2023)
- La Ramera de Baxu (2000-2023)
- La Ramera de Riba (2000-2023)
- La Salguera (2000-2023)
- La Siega (2000-2023)
- La Torre (2000-2023)
- La Vallina (2000-2023)
- La Vinaquera (2000-2023)
- La Xirán (2000-2023)
- Lagar (2000-2023)
- Las Bárzanas (2000-2023)
- Las Cepas (2000-2023)
- Las Chabolas (2000-2023)
- Las Llascaras (2000-2023)
- Las Lunas (2000-2023)
- Las Martiniegas (2000-2023)
- Las Vallinas (2000-2023)
- Las Vinadas (2000-2023)
- Les Pedreres (2000-2023)
- Linares (2000-2023)
- Llazandi (2000-2023)
- Llodares (2000-2023)
- Llordal (2000-2023)
- Los Caleyos (2000-2023)
- Los Carbayos (2000-2023)
- Merujeras (2000-2023)
- Moire (2000-2023)
- Navalón (2000-2023)
- Naveces (2000-2023)
- Orbón (2000-2023)
- Palancas (2000-2023)
- Peñarréi (2000-2023)
- Piarnu (2000-2023)
- Piedrasblancas (2000-2023)
- Pipe (2000-2023)
- Prado del Valle (2000-2023)
- Pulide (2000-2023)
- Pumeo (2000-2023)
- Raíces Nuevo/La Fundición (2000-2023)
- Reguero del Medio (2000-2023)
- Romadoriu (2000-2023)
- Sala (2000-2023)
- Salinas (2000-2023)
- Samartín de L'Aspra (2000-2023)
- Samiguel (2000-2023)
- Samiguel de Quiloñu (2000-2023)
- San Adriano (2000-2023)
- San Adrianu (2000-2023)
- San Amaro (2000-2023)
- San Francisco (2000-2023)
- Santa María del Mar/El Puertu (2000-2023)
- Santiagu'l Monte (2000-2023)
- Teboyas (2000-2023)
- Tresvalles (2000-2023)
- Valboniel (2000-2023)
- Vegarrozadas (2000-2023)
- Ventaniella (2000-2023)
- Villar de Arriba (2000-2023)
- Viña del Mar (2000-2023)
Elaboracion:Foro-ciudad.com (Se puede usar todo el contenido, insertando link a esta pagina).
Fuentes:
Instituto Nacional de Estadística
1900-1981: Poblaciones de hecho desde 1900 hasta 1991. Cifras oficiales sacadas de los Censos respectivos.
1986-1995: Poblaciones de derecho desde 1986 hasta 1995. Cifras de las rectificaciones y renovaciones Padrónales.
1996-2024: Cifras Oficiales de Población de los Municipios Españoles:Revisión del Padrón Municipal.
Medición del turismo a partir de la posición de los teléfonos móviles.
Ministerio de Hacienda y Administraciones Públicas
Agencia Tributaria
Servicio Público de Empleo Estatal
Seguridad Social
Ministerio de Fomento
DGT
Catastro *Datos no disponibles para Navarra y Pais Vasco.


